Data flows through every layer of modern care delivery, but clarity often remains limited. Clinical operations, revenue cycle performance, staffing capacity, quality reporting, and regulatory compliance all generate constant signals. However, when those signals sit in separate systems, leadership teams see inconsistent numbers. As a result, time is spent validating reports instead of improving throughput or protecting margins. In high-volume, multi-site environments, this delay directly impacts financial performance and operational control.
Strong data visualization architecture in a healthcare app brings order to this complexity. It connects managed data sources, standardizes metric definitions, and matches real-time insights with historical context. This allows operations leaders to address bottlenecks early. Finance teams also gain clear performance visibility without needing reconciliation cycles. Compliance teams can maintain traceable audit paths across regions and service lines.
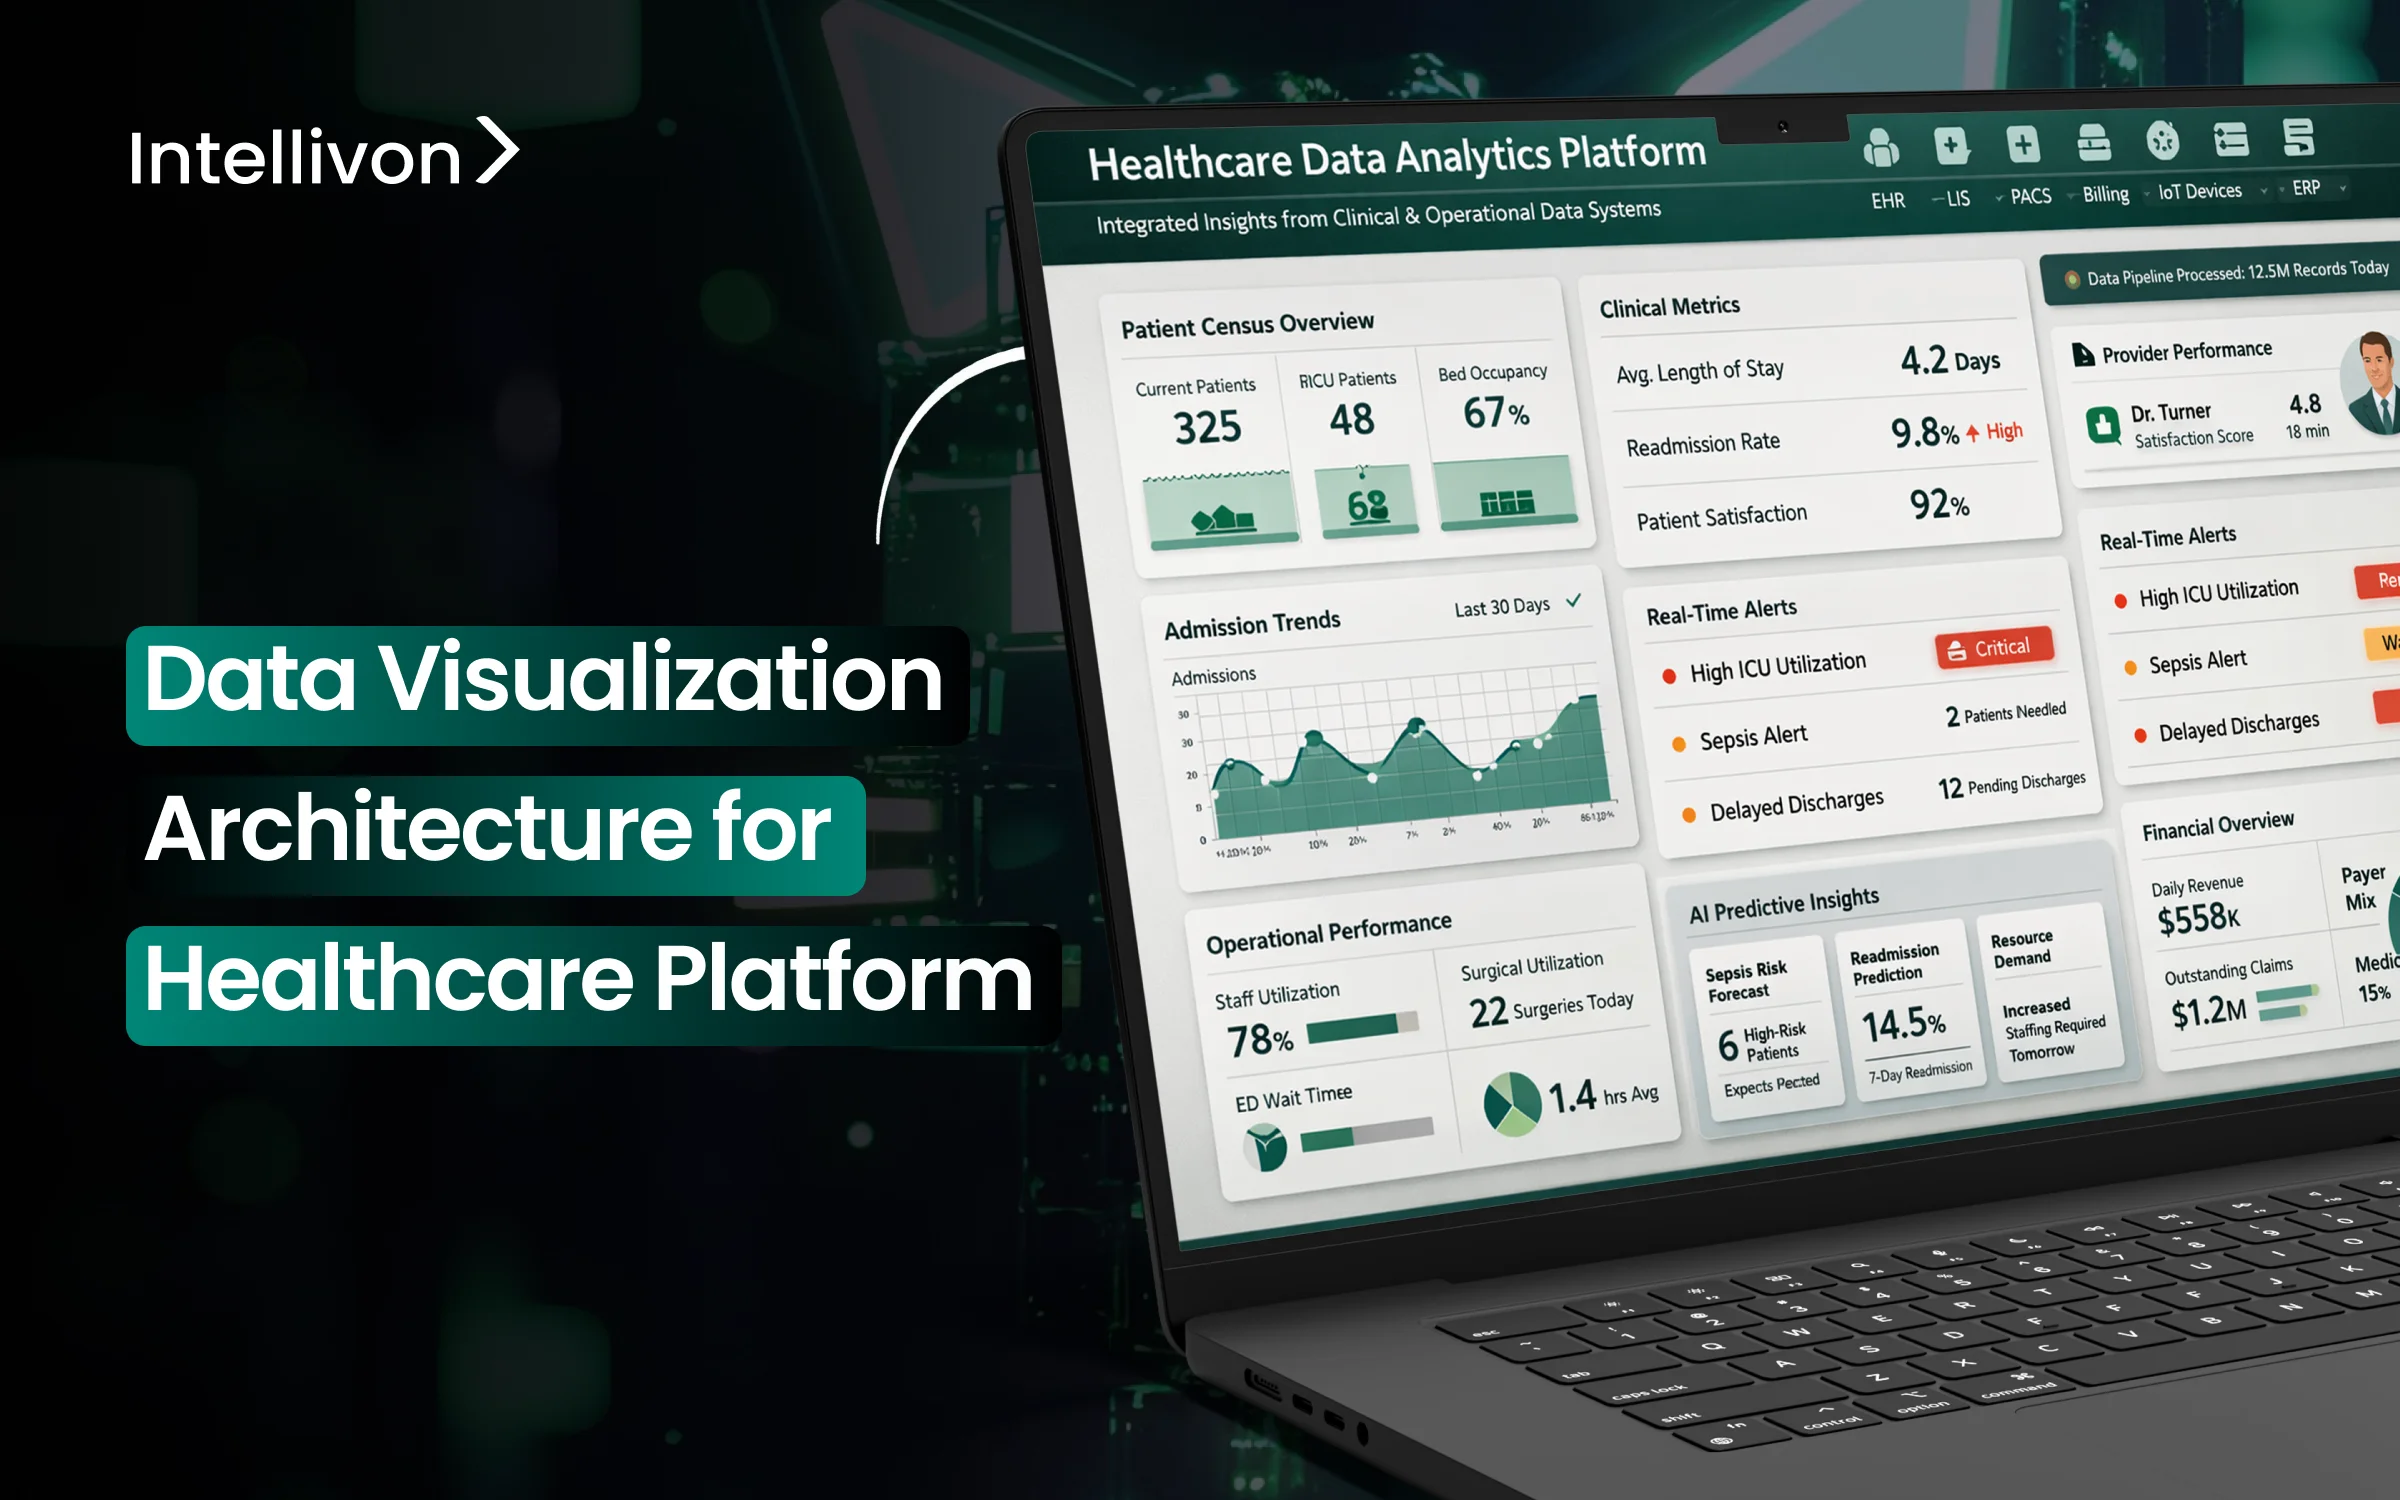
At Intellivon, we build data visualization as enterprise infrastructure rather than superficial dashboards. We create managed data layers, scalable pipelines, and AI-ready analytics environments that stay stable under regulatory and operational pressure. In this blog, we will look at how to build these platforms, where large enterprises typically face challenges, and how the right foundation can turn visibility into measurable growth.

Why Data Visualization Matters For Healthcare Platforms
The data visualization market is expanding rapidly as enterprises generate more data and demand faster insight. Growth is fueled by rising data volumes, deeper AI integration, and the need for real-time analytics across sectors, including healthcare. Current projections estimate the market will reach approximately USD 10.92 billion in 2025. Moreover, it is expected to grow at a CAGR of around 10.95%, reaching nearly USD 18.36 billion by 2030.
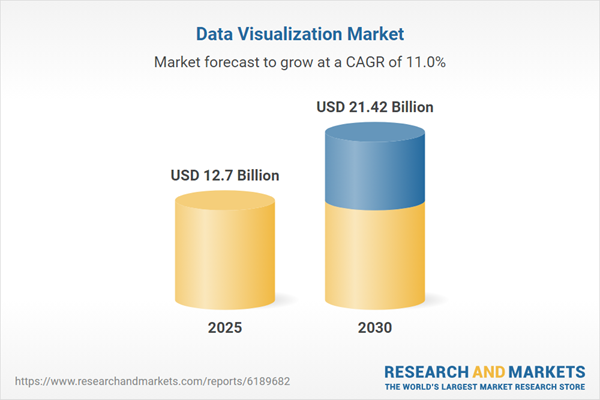
Alternative industry forecasts show a similar trajectory. Some estimates place the market closer to USD 12.7 billion in 2025. In addition, projections suggest it could reach USD 21.42 billion by 2030, reflecting a CAGR of approximately 11.02 percent. Together, these figures signal sustained enterprise investment in advanced data visualization platforms.
Market Insights:
- Explosive growth in big data from IoT, wearables, and EHRs requires advanced tools for real-time insight and pattern detection.
- Rapid adoption of AI and machine learning enables predictive analytics and automated insights, reducing manual reporting effort.
- Shift to cloud platforms supports scalable dashboards, multi-device access, and secure self-service business intelligence.
Why Healthcare Enterprises Are Investing in Visualization Architecture Now
Enterprises are investing in visualization architecture because the cost of operational inefficiency is rising. Labor expenses increased about 5% per calendar day in 2025 compared to 2024, adding pressure to already tight margins. Therefore, leaders need faster visibility into bottlenecks and resource use.
In addition, fragmented systems carry a measurable financial burden. Research estimates that poor interoperability costs the U.S. health system more than USD 30 billion annually due to duplicate work and delayed decisions.
These numbers make the ROI case clear. Investing now reduces cost leakage and strengthens execution control.
What Is Data Visualization Architecture for Healthcare Platforms?
Data visualization architecture for healthcare platforms is the structured design that connects raw data to clear, reliable insight. It defines how data is collected from clinical, financial, and operational systems. At the same time, it also standardizes how metrics are calculated and presented. Therefore, every dashboard reflects one consistent version of the truth.
This architecture includes data pipelines, governed data models, semantic layers, and secure access controls. In addition, it supports real-time updates and historical analysis in the same environment. When designed correctly, it ensures leaders can trust what they see, trace every number to its source, and act quickly without debating data accuracy.
Data visualization architecture for healthcare platforms provides the structure that turns complex data into clear, trusted insight. It connects multiple systems, aligns definitions, and ensures leaders see consistent information across departments and regions. Therefore, it must be designed with governance, scalability, and performance in mind from the start.
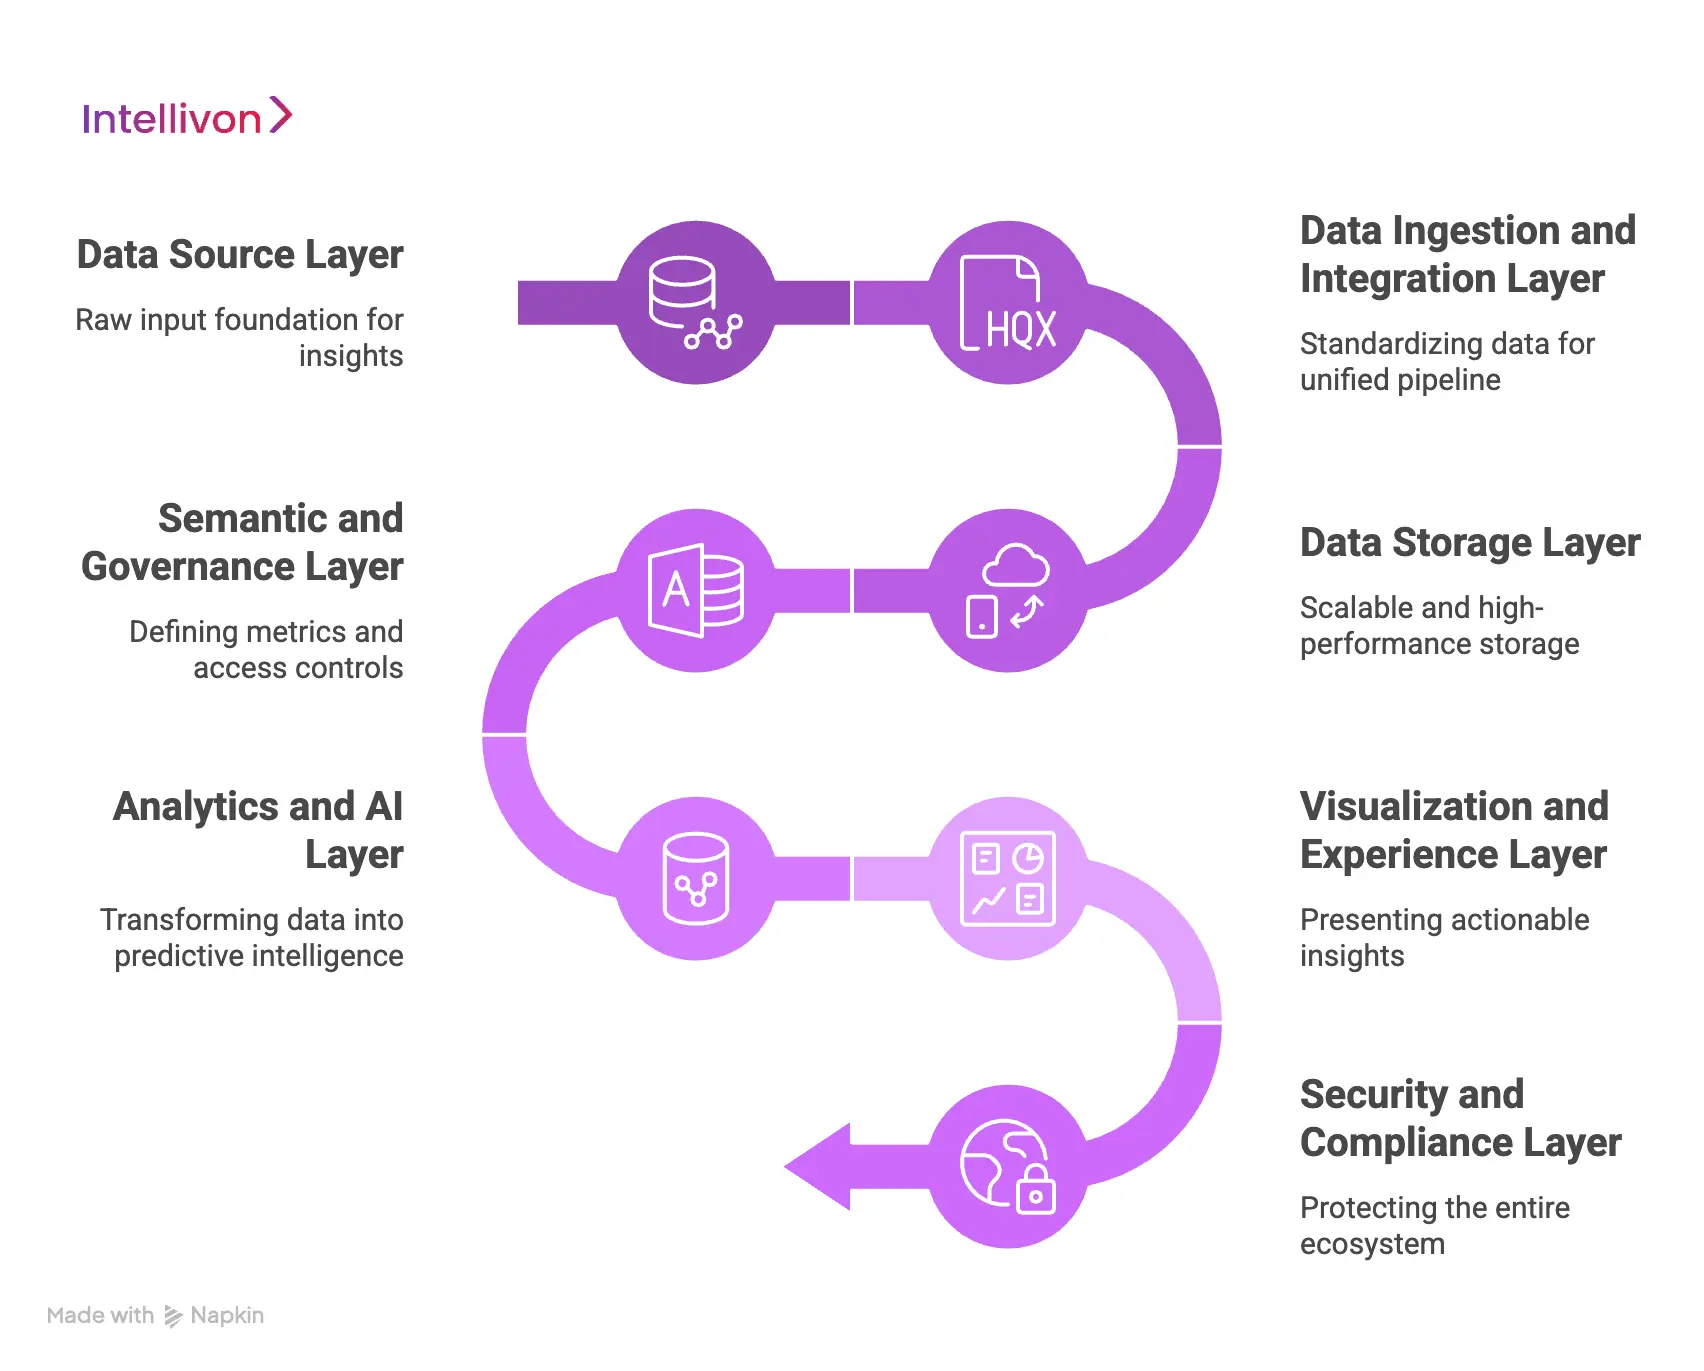
Basic Architecture Overview
- Data Sources Layer: Clinical systems, EHRs, revenue cycle tools, staffing platforms, IoT devices, and external datasets.
- Data Ingestion Layer: Secure pipelines that extract, clean, and standardize data in real time or scheduled batches.
- Data Storage Layer: Centralized data warehouse or lakehouse designed for structured and semi-structured data.
- Semantic and Modeling Layer: Standardized definitions, metric calculations, and governed business logic.
- Analytics and AI Layer: Forecasting models, anomaly detection, and performance benchmarking.
- Visualization Layer: Role-based dashboards, operational views, and executive reporting interfaces.
- Governance and Security Layer: Access controls, audit trails, compliance policies, and monitoring systems.
When these layers work together, organizations gain consistent visibility across clinical, financial, and operational performance. In addition, they reduce data disputes and accelerate decision-making. The architecture becomes a control framework, not just a reporting tool.
Core Objectives of Data Visualization Architecture for Healthcare Platforms
Data visualization architecture must serve clear enterprise objectives. It cannot exist only to produce reports. Instead, it should improve operational control, financial oversight, compliance confidence, and strategic agility.
Therefore, each design decision must connect directly to measurable outcomes across the organization.
1. Create One Trusted Source of Truth
Healthcare platforms often pull data from multiple clinical and financial systems. However, inconsistent definitions lead to conflicting numbers.
Strong architecture standardizes metrics across departments and regions. As a result, leadership teams spend less time reconciling data and more time acting on it.
2. Enable Real-Time Operational Visibility
Delays in insight create delays in response. Therefore, the architecture must support near-real-time data feeds.
Operations teams can identify bottlenecks early, while finance teams can track margin shifts without waiting for month-end reports. Timely visibility reduces reactive decision-making.
3. Strengthen Compliance and Audit Readiness
Healthcare environments operate under strict regulatory frameworks. In addition, reporting errors can carry financial and reputational risk.
A governed visualization architecture ensures traceability for every metric. Audit trails, access controls, and documented logic build defensible reporting structures.
4. Support Predictive and Strategic Planning
Historical reporting alone is no longer enough. Enterprises need forecasting and scenario modeling to plan staffing, capacity, and financial performance.
Therefore, the architecture must integrate AI and advanced analytics capabilities. This allows leaders to anticipate pressure rather than respond after impact.
5. Scale Across Regions and Service Lines
Growth adds complexity. New hospitals, service lines, or digital programs increase data volume and variability.
A scalable architecture adapts without redesigning dashboards from scratch. Consequently, insight remains consistent as the enterprise expands.
When these objectives guide the design, data visualization becomes a strategic asset rather than a reporting expense. It strengthens control, reduces uncertainty, and positions the organization to grow with confidence.
Architecture for Data Visualization in Healthcare Platforms
Data visualization delivers value only when the underlying architecture is intentional, governed, and built for scale. In healthcare platforms, this architecture must support operational visibility, financial control, regulatory reporting, and predictive planning simultaneously.
Therefore, each layer must serve a defined purpose. When designed correctly, the system produces clarity instead of confusion. Below is a structured architectural framework suited for enterprise healthcare environments.
1. Data Source Layer
This layer includes every system that generates meaningful operational and financial signals across the enterprise. It forms the raw input foundation for all downstream insight. Because healthcare ecosystems are fragmented, mapping and completeness matter from the start.
Typical sources include:
- Electronic Health Records (EHR)
- Revenue cycle and billing systems
- Scheduling and workforce platforms
- Supply chain and asset management tools
- IoT devices and remote monitoring systems
- External regulatory and benchmarking datasets
Each source produces data in different formats and frequencies. Therefore, alignment begins here. If data gaps exist at this stage, dashboards will never reflect full operational reality.
2. Data Ingestion and Integration Layer
This layer moves and standardizes data from source systems into a unified pipeline. However, it does more than transfer information. It validates, cleanses, transforms, and normalizes data before storage.
Core components include:
- HL7 and FHIR integrations
- API-based system connections
- Real-time event streaming
- Scheduled batch ingestion
- Data validation and transformation rules
For example, different facilities may calculate census or margin differently. Therefore, this layer enforces consistency before analytics begin. Without semantic control here, reporting discrepancies multiply downstream.
3. Data Storage Layer
This layer stores structured and semi-structured data in a scalable, high-performance environment. It supports both historical analysis and real-time operational reporting. Because healthcare data volumes are high and constantly growing, performance engineering is essential.
Common storage elements include:
- Enterprise data warehouse or lakehouse
- Partitioned storage for performance optimization
- Cloud-native scalability features
- Backup and disaster recovery systems
A strong storage layer ensures dashboards respond quickly, even during peak usage. In addition, it supports long-term trend analysis without slowing daily operations.
4. Semantic and Governance Layer
This layer defines how metrics are calculated and who can access them. It standardizes business logic across departments and ensures consistency across regions. Governance at this level protects credibility.
Key elements include:
- Centralized metric definitions
- Standardized calculation logic
- Role-based access controls
- Audit logging and traceability
- Data quality monitoring systems
Without this layer, different teams interpret the same numbers differently. Therefore, governance ensures that every visualization reflects one consistent enterprise truth.
5. Analytics and AI Layer
This layer transforms structured data into forward-looking insight. It moves beyond descriptive reporting into predictive and prescriptive intelligence. However, AI models must rely on governed data to remain accurate and defensible.
Capabilities often include:
- Predictive capacity and demand modeling
- Financial forecasting
- Anomaly detection
- Performance benchmarking
When integrated properly, this layer helps leaders anticipate constraints rather than react to them.
6. Visualization and Experience Layer
This layer translates analytics into actionable insight. It presents role-based views tailored to executives, operations managers, finance teams, and compliance leaders. Clarity and usability are critical here.
Core elements include:
- Executive performance dashboards
- Operational command center panels
- Department-level reporting views
- Self-service analytics tools
- Mobile-accessible interfaces
The objective is focus. Each user should see relevant metrics that drive action, not excess data that increases noise.
7. Security and Compliance Layer
This layer protects the entire ecosystem. Healthcare environments operate under strict regulatory requirements, so visualization platforms must meet enterprise security standards.
Foundational controls include:
- Encryption in transit and at rest
- Identity and authentication management
- Compliance monitoring frameworks
- Incident detection and alerting systems
Security is not an add-on. It is embedded across every layer of the architecture.
When these layers operate together, data visualization becomes a stable enterprise capability rather than a reporting experiment. In addition, scalability improves because each layer performs a defined role. As complexity grows, the architecture absorbs it without compromising trust or performance.
Data Governance Strategy for Data Visualization Architecture
Data visualization only works when the underlying data is trusted. Therefore, a clear data governance strategy must sit at the center of the architecture.
Without governance, dashboards become inconsistent, compliance risk increases, and leadership confidence declines. In regulated healthcare environments, governance is not optional. It is foundational.
1. Define Ownership Clearly
Every metric must have a defined owner. This includes clinical indicators, financial KPIs, operational metrics, and compliance measures.
When ownership is unclear, definitions drift over time. Therefore, assign accountable leaders for metric logic, updates, and validation.
2. Standardize Definitions
Different facilities often calculate the same metric differently. For example, census or margin calculations may vary by region. Governance ensures one standardized definition across the enterprise. As a result, dashboards reflect a consistent version of the truth.
3. Implement Role-Based Access
Not every user should see every dataset. Role-based access controls ensure sensitive information is restricted appropriately. In addition, access policies must align with HIPAA, GDPR, and regional regulations. This protects both patient data and organizational integrity.
4. Establish Data Quality Controls
Data must be validated before it reaches dashboards. Therefore, implement automated checks for completeness, accuracy, and timeliness. Ongoing monitoring helps identify anomalies early. This reduces reporting errors and audit exposure.
5. Maintain Audit Trails
Every metric should be traceable back to its source. Governance frameworks must log changes in logic, data transformations, and user access. Consequently, organizations can defend their reporting during audits or regulatory reviews.
When governance is embedded into the architecture, data visualization becomes reliable and defensible. In addition, it strengthens accountability across departments. Strong governance transforms dashboards from visual tools into enterprise-grade decision systems.
Advanced Features of Data Visualization Architecture for Healthcare Platforms
Basic dashboards are no longer enough for large healthcare platforms. Leaders now expect systems that predict risk, guide action, and adapt as complexity increases. Therefore, advanced features must be built directly into the data visualization architecture.
When designed properly, these capabilities move the platform from descriptive reporting to strategic control.
1. Real-Time Streaming Dashboards
Modern healthcare operations run continuously. Therefore, the architecture should support event-driven data streaming. Real-time dashboards allow teams to monitor admissions, discharge delays, staffing shortages, and revenue fluctuations as they happen.
In addition, early visibility reduces reactive decision-making and limits operational disruption.
2. Predictive and Prescriptive Analytics
Historical reporting explains what happened. However, predictive models estimate what is likely to happen next. Advanced visualization layers integrate AI models for capacity forecasting, margin projections, and anomaly detection.
Consequently, leaders can test scenarios before making operational changes. This strengthens planning and reduces uncertainty.
3. Role-Based Dynamic Views
Different users require different perspectives. Executives need enterprise-wide performance summaries, while operational managers need workflow-level detail.
Therefore, advanced architectures provide dynamic dashboards that adapt to role, region, and responsibility. This improves clarity and reduces information overload.
4. Drill-Down and Root Cause Exploration
Surface metrics are useful, but actionable insight requires depth. Advanced platforms allow users to drill from enterprise summaries into unit-level or transaction-level data.
In addition, root cause tools help identify why performance shifted. This shortens investigation cycles and supports faster resolution.
5. Embedded Alerts and Threshold Triggers
Visualization should not rely on manual monitoring. Therefore, the architecture should include automated alerts based on predefined thresholds. For example, if bed occupancy exceeds limits or claim denials spike, stakeholders receive immediate notifications. This proactive layer strengthens operational responsiveness.
6. Cross-System Benchmarking
Enterprises often operate across multiple facilities or regions. Advanced visualization architecture supports internal benchmarking and external comparisons.
As a result, leaders can identify performance gaps and prioritize improvement initiatives. Benchmarking transforms isolated metrics into competitive insight.
7. Self-Service Analytics with Governance Controls
Empowering teams to explore data independently increases agility. However, self-service must operate within governed boundaries.
Advanced architectures enable controlled data exploration while preserving standardized metric definitions. Consequently, innovation does not compromise data integrity.
When these advanced features are integrated thoughtfully, data visualization becomes a strategic capability rather than a static reporting tool. In addition, it enhances foresight, accelerates execution, and strengthens accountability across the enterprise. Over time, this maturity converts visibility into measurable operational and financial advantage.
How We Build Data Visualization Architecture for Healthcare Platforms
Building data visualization architecture in healthcare requires more than dashboards and connectors. It requires a structured delivery process that protects governance, performance, and adoption from day one.
Therefore, our approach focuses on creating a reliable foundation first, then layering insights and advanced capabilities on top. This reduces rework, accelerates time to value, and improves long-term scalability.
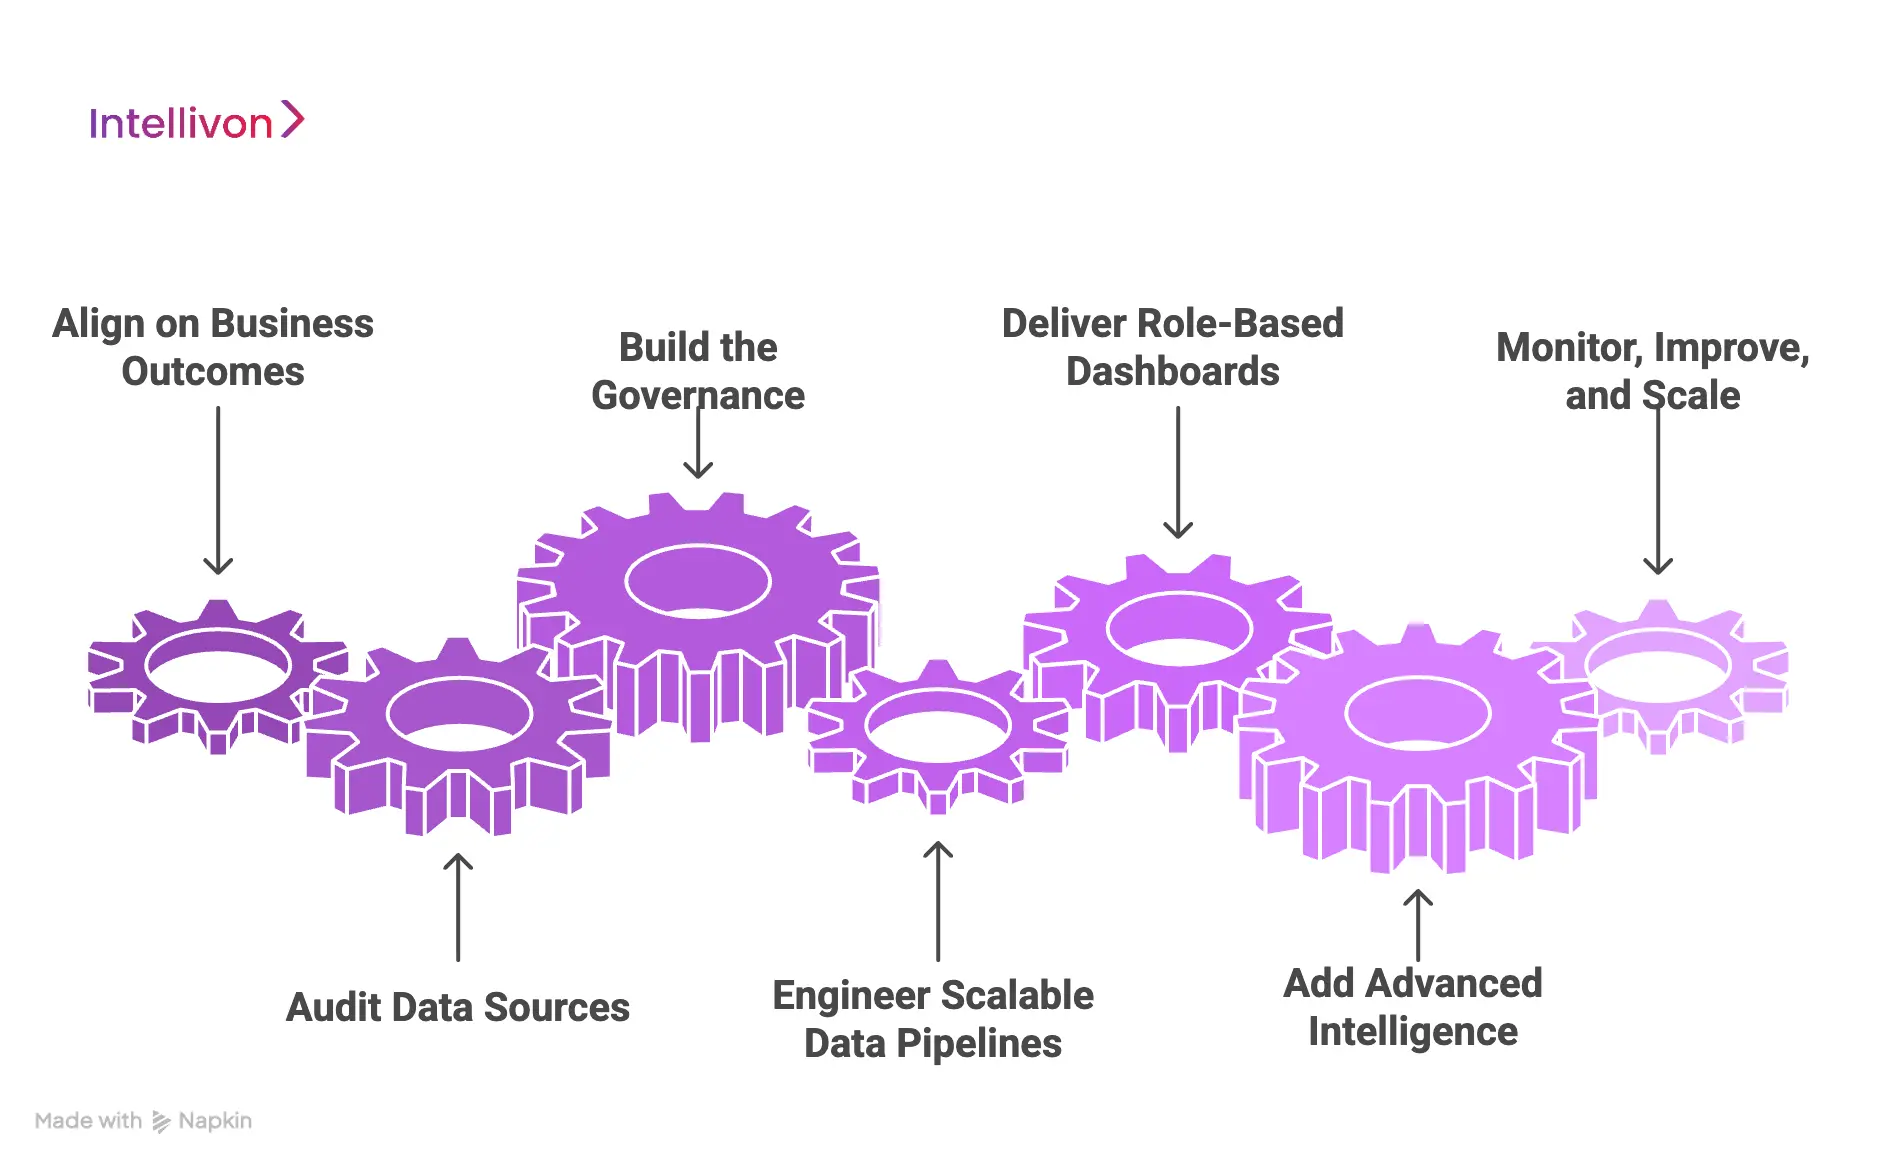
1. Align on Business Outcomes
We start by mapping the decisions the platform must support. This includes operational control, financial oversight, compliance reporting, and strategic planning. In addition, we define who uses each view and what action follows insight. This ensures dashboards drive execution, not passive reporting.
2. Audit Data Sources
Next, we inventory clinical, financial, and operational systems across the enterprise. We evaluate data quality, latency needs, and interoperability constraints. Therefore, integration planning reflects real system behavior, not assumptions. This phase also identifies where definitions diverge across facilities.
3. Build the Governance
At Intellivon, governance is not a final step. It is the starting point. We establish metric ownership, standardized definitions, and controlled access policies. In addition, we create a semantic model that ensures every KPI is calculated consistently. This prevents leadership teams from debating data credibility later.
4. Engineer Scalable Data Pipelines
We then build ingestion pipelines for real-time and batch data. This includes validation, transformation, and normalization logic. Therefore, dashboards draw from clean, stable data flows. We also design warehouse or lakehouse storage for scale and performance, so insights remain fast under heavy enterprise usage.
5. Deliver Role-Based Dashboards
Once the foundation is stable, we build role-based experiences. Executives receive enterprise summaries, while operational teams get workflow-level visibility. In addition, we design drill-down paths that support root cause analysis. This keeps dashboards actionable and reduces noise.
6. Add Advanced Intelligence
After adoption stabilizes, we integrate predictive analytics, anomaly detection, and alert triggers. However, we keep human oversight built into high-impact workflows. Therefore, automation strengthens decision-making without creating compliance or safety risks.
7. Monitor, Improve, and Scale Across the Enterprise
Finally, we implement observability across pipelines, dashboards, and metric usage. We track performance, data quality, and adoption. Consequently, the platform improves over time and scales across regions and service lines without breaking governance.
This is how Intellivon builds data visualization architecture that enterprise healthcare leaders can rely on. It reduces data disputes, strengthens compliance confidence, and turns visibility into faster execution. Most importantly, it creates a foundation that supports growth rather than limiting it.
Conclusion
In addition, strong governance and scalable pipelines reduce risk as complexity increases. Organizations that invest in the right architecture today gain clearer control over operations and margins tomorrow. Intellivon helps enterprises build this foundation with discipline and precision.
The result is not just better dashboards, but stronger execution across the entire healthcare platform.
Build Enterprise Data Visualization Architecture With Intellivon
At Intellivon, data visualization platforms are built as governed enterprise infrastructure, not as dashboards layered onto fragmented systems. Every architectural and delivery decision prioritizes metric integrity, performance scalability, security controls, and regulatory alignment. This ensures visualization environments operate reliably across clinical operations, finance, compliance, and executive leadership, not just during initial rollout.
As data volume, system integrations, and AI adoption expand, stability becomes critical. Governance models, semantic standardization, and audit readiness remain consistent as usage scales across regions and service lines. Organizations retain control over definitions, access, and data lineage without introducing reporting conflicts, compliance risk, or operational friction.
Why Partner With Intellivon?
- Enterprise-grade data visualization architecture designed for regulated healthcare ecosystems
- Proven delivery across multi-site health systems and complex integration environments
- Governance-first semantic modeling ensures one consistent version of the truth
- Secure, scalable infrastructure supporting cloud, hybrid, and on-prem deployments
- AI-enabled predictive analytics with built-in oversight and traceability
- Performance-optimized pipelines engineered for real-time and high-volume workloads
- Structured implementation approach that minimizes disruption and accelerates ROI
Book a strategy call to explore how Intellivon can help you architect, deploy, and scale enterprise-grade data visualization platforms with confidence, control, and measurable impact.
FAQs
Q1. What is data visualization architecture in healthcare?
A1. Data visualization architecture in healthcare is the structured framework that connects clinical, financial, and operational data into governed dashboards. It defines how data is collected, standardized, stored, and presented. Therefore, leaders see one consistent version of the truth. In addition, it ensures every metric is traceable, secure, and aligned with compliance requirements.
Q2. Why is data governance important in healthcare dashboards?
A2. Healthcare data is highly regulated and sensitive. Without governance, dashboards can show inconsistent or inaccurate metrics. Therefore, data governance standardizes definitions, controls access, and maintains audit trails. As a result, leadership teams trust the numbers and reduce compliance risk.
Q3. How does data visualization improve hospital operations?
A3. Data visualization improves hospital operations by providing real-time insight into patient flow, staffing levels, revenue cycle performance, and resource utilization. Consequently, teams identify bottlenecks earlier and respond faster. In addition, predictive analytics helps anticipate demand rather than react after delays occur.
Q4. What are the key components of a healthcare data visualization architecture?
A4. A strong architecture includes data sources, integration pipelines, centralized storage, a semantic layer, analytics capabilities, dashboards, and governance controls. Each layer serves a defined role. Therefore, the system remains scalable, secure, and reliable as data volumes grow.
Q5. How long does it take to implement a data visualization architecture for healthcare platforms?
A5. Implementation timelines vary based on system complexity and integration scope. However, enterprises typically see measurable value within a few months when governance and core workflows are prioritized first. In addition, phased rollouts reduce operational disruption and improve long-term adoption.