Achieving complete visibility and control over SaaS spending is fundamental to the financial and operational stability of an enterprise. As they adopt hundreds of SaaS applications across departments, costs often spiral out of control. Redundant subscriptions, unused licenses, and unnoticed auto-renewals silently eat away at budgets, while compliance blind spots introduce unnecessary risk. An enterprise-grade, tailored SaaS cost governance dashboard addresses these challenges by unifying fragmented financial and usage data into clear, actionable recommendations that drive smarter decisions.
At Intellivon, we design and deploy SaaS cost governance dashboards for enterprises operating at scale. Through these dashboards, our clients often realize substantial savings in the first quarter, strengthen compliance readiness for audits, and gain tighter control over SaaS renewals and vendor negotiations. In this blog, we share what these dashboards include, how they deliver measurable impact, and the framework we follow to build them for lasting enterprise value.

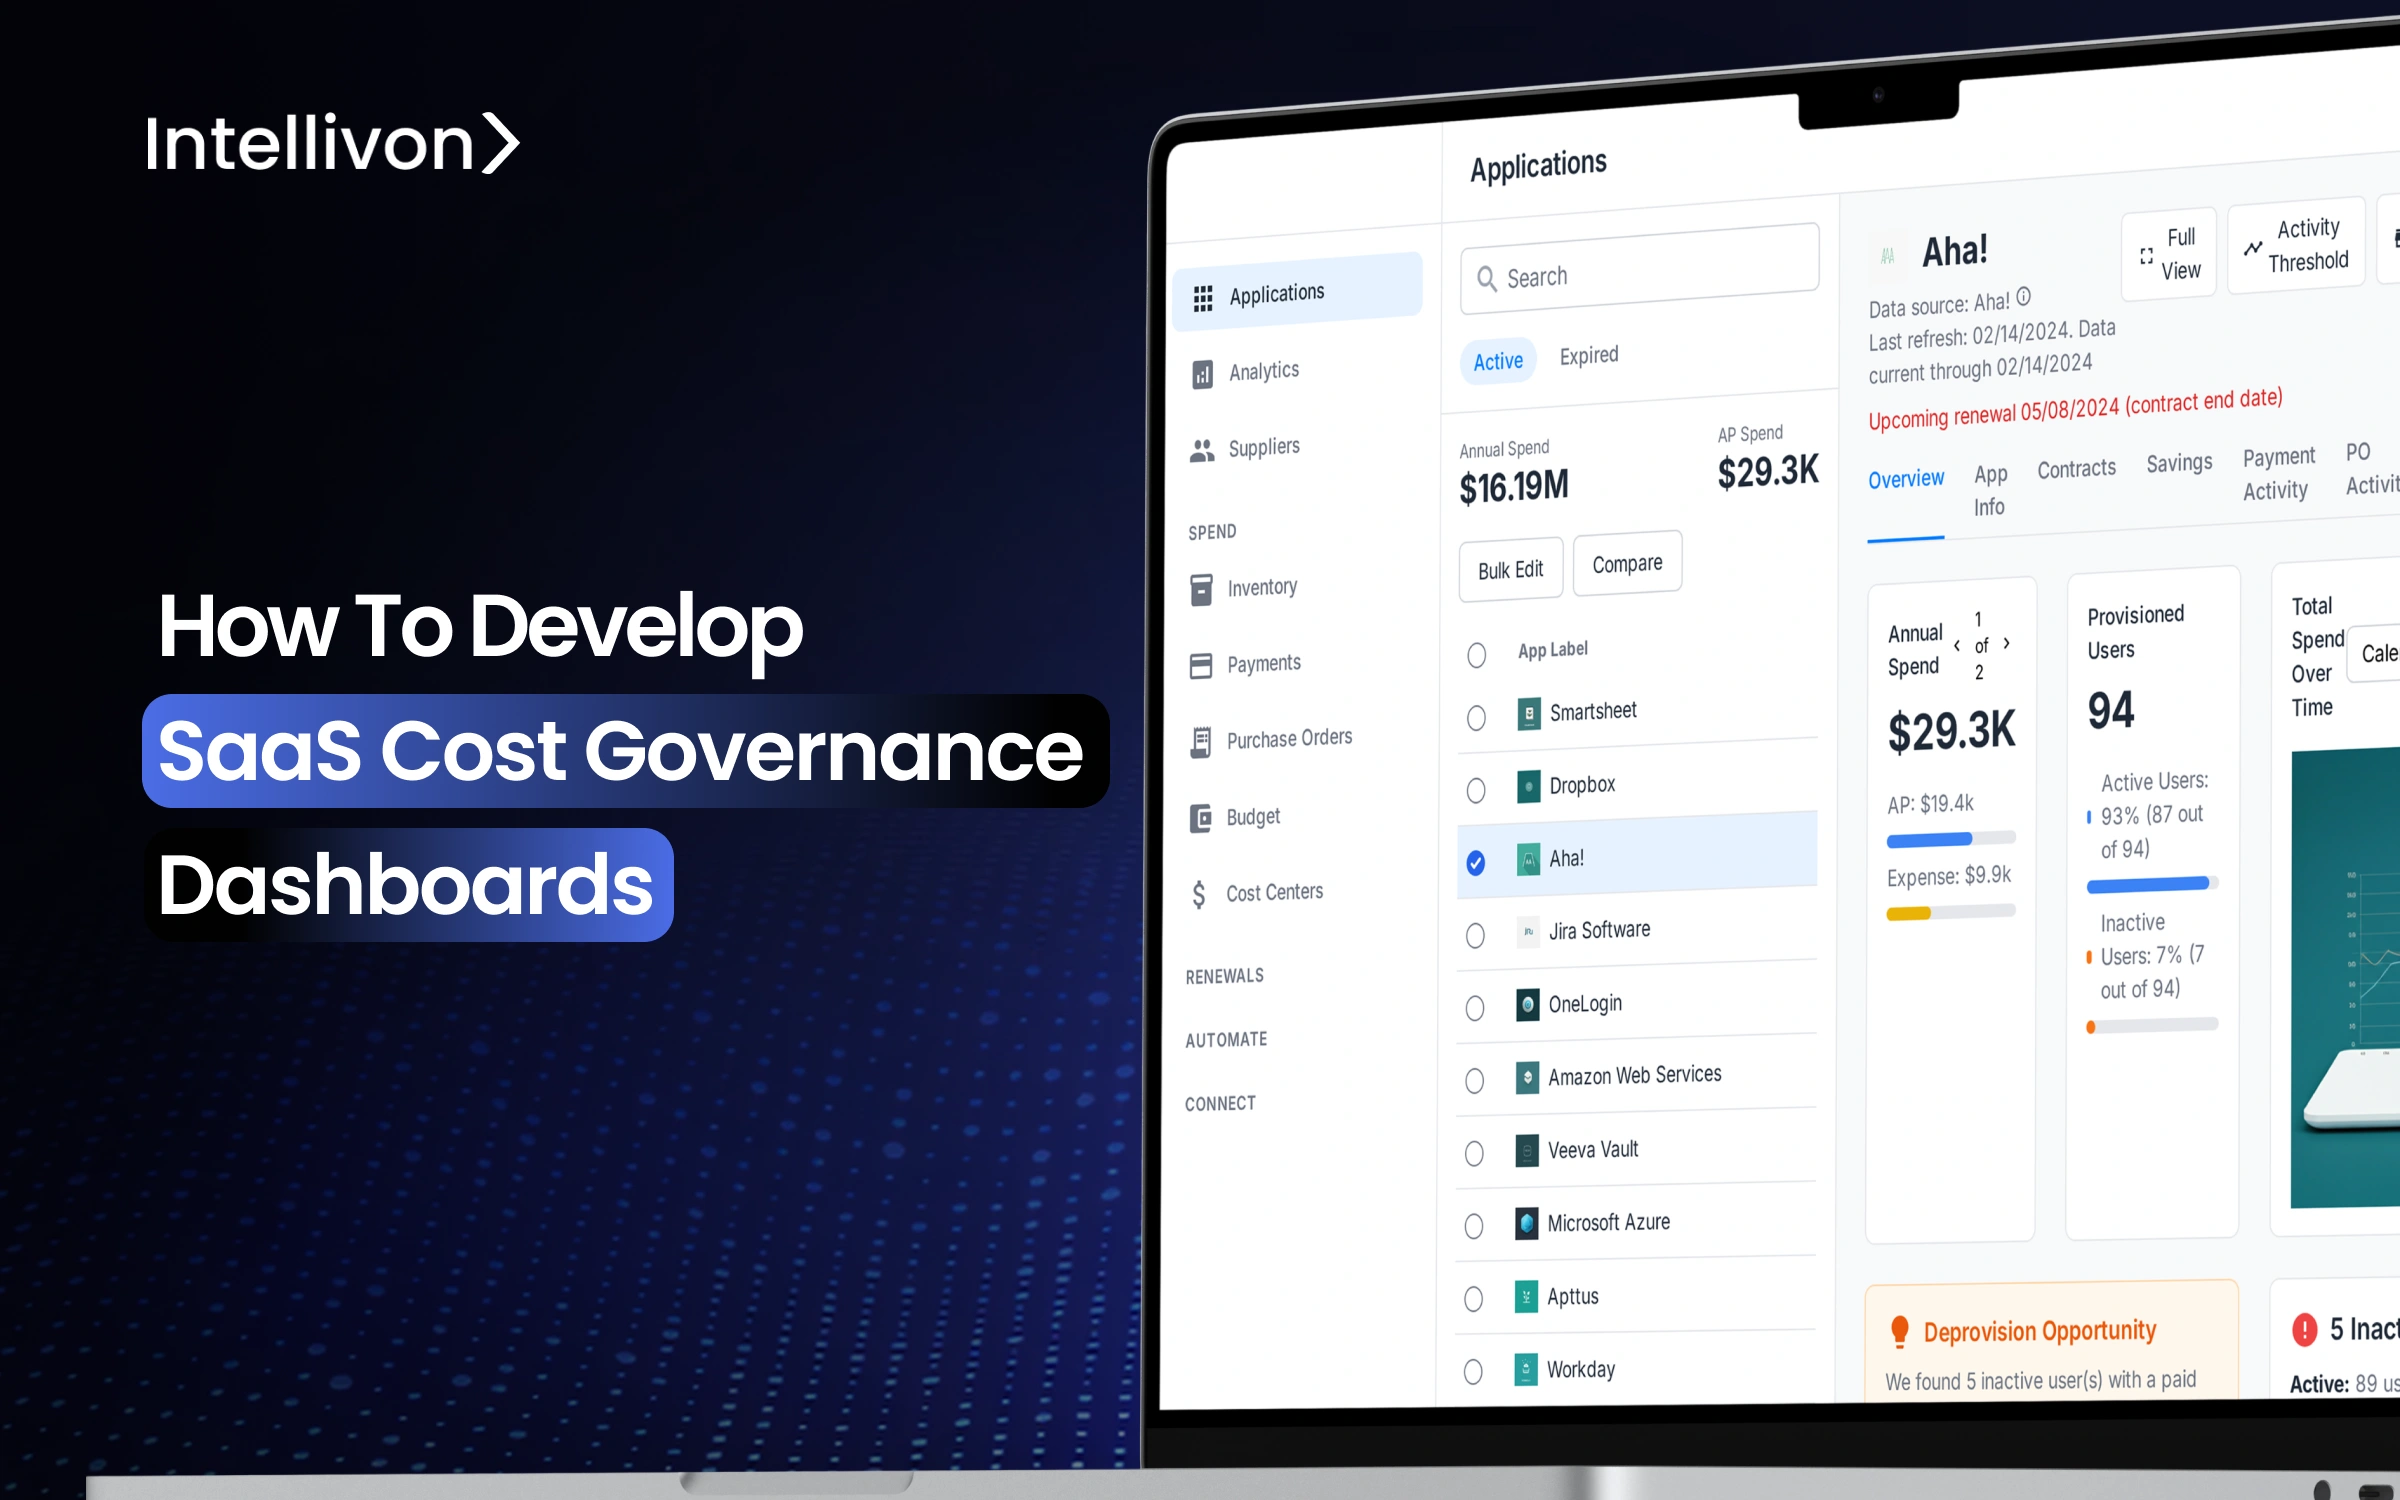
What Are SaaS Cost Governance Dashboards?
In the enterprise context, a SaaS cost governance dashboard acts as the single control panel for managing software subscriptions. Instead of relying on scattered spreadsheets, siloed departmental reports, and fragmented invoices, it provides one consolidated view of every application in use, what it costs, and how it is being adopted across the business.
These dashboards bring together financial, technical, and compliance data that would otherwise remain isolated. They show whether licenses are being used, where applications overlap, when renewals are approaching, and if vendors meet regulatory standards. This unified visibility allows decision makers to replace assumptions with evidence and to manage SaaS portfolios with greater precision.
For large organizations, the real power of these dashboards is in transforming SaaS management from a reactive activity into a proactive discipline. Instead of chasing down hidden costs after they accumulate, enterprises gain a system that continuously monitors, informs, and guides smarter decisions about software investments.
Key Takeaways of the SaaS Market
The SaaS market is expected to grow from $253.6 billion in 2025 to $308.4 billion by 2029, at a 5% CAGR. On a closer look, the sector records an annual growth rate of about 12%.
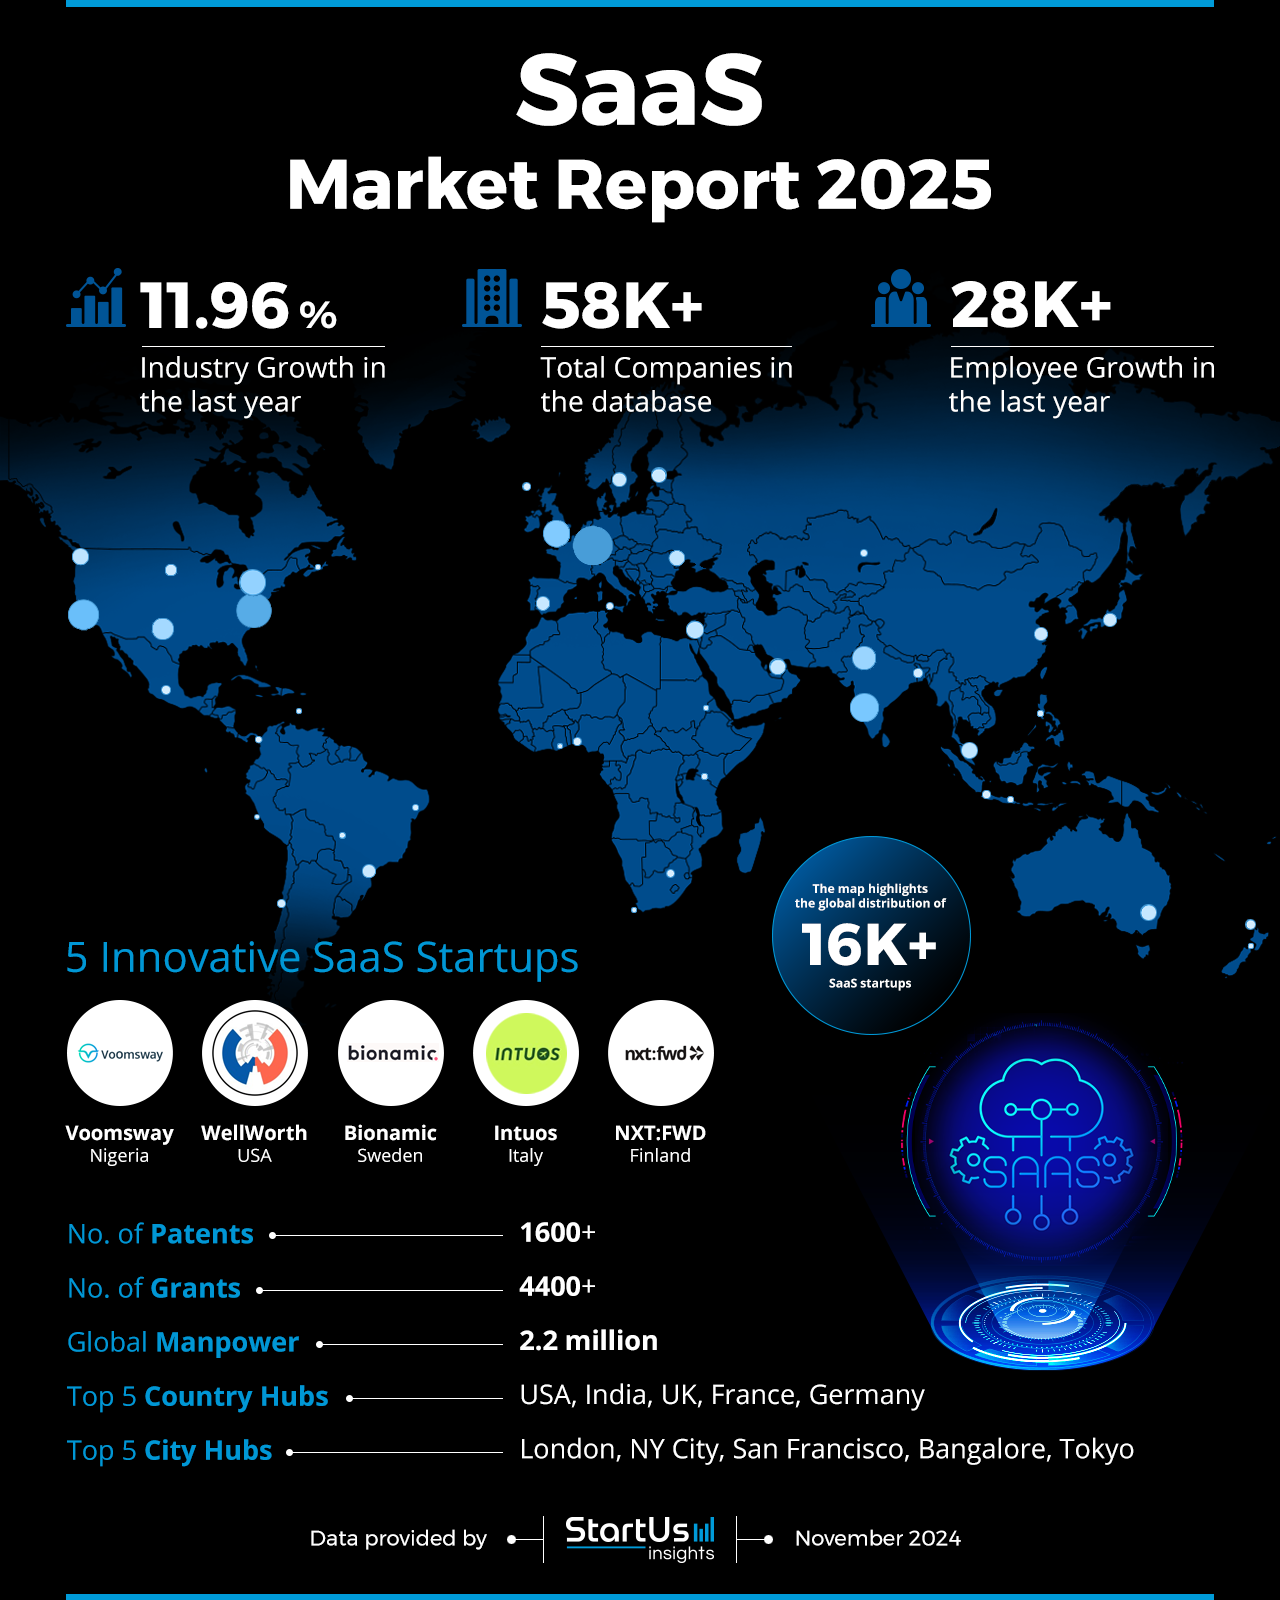
- Software subscriptions have become one of the largest operating costs for companies, averaging $8,800 per employee, which is a 27.5% year-over-year increase.
- SaaS Waste & Shadow IT: Up to 53% of licenses go unused, costing enterprises over $21M annually, while shadow IT adds 40% more apps than IT teams realize.
- Cost Optimization & Visibility: 70% of IT teams now use centralized management dashboards for spend tracking, redundancy reduction, and automation, yet only 30% of organizations have effective purchasing and renewal processes.
- Key Metrics for Dashboards: Leading tools track license utilization, renewal calendars, churn, ROI per SaaS, NRR, and cost per user. CFOs demand visibility into renewals, unused apps, and budget vs. spend.
- AI, Automation & Financial Impact: AI-driven analytics and automation save 20–30% of SaaS budgets annually, while accurate attribution and KPIs like CAC Payback and NRR are vital for sustainable growth.
Types of SaaS Cost Governance Dashboards Enterprises Use
Enterprises adopt SaaS cost governance dashboards in different ways depending on their priorities. Some focus on license visibility, others on financial control, while the most advanced bring automation into everyday workflows. Understanding the types of dashboards available helps leaders decide which combination will deliver the greatest value for their organization.
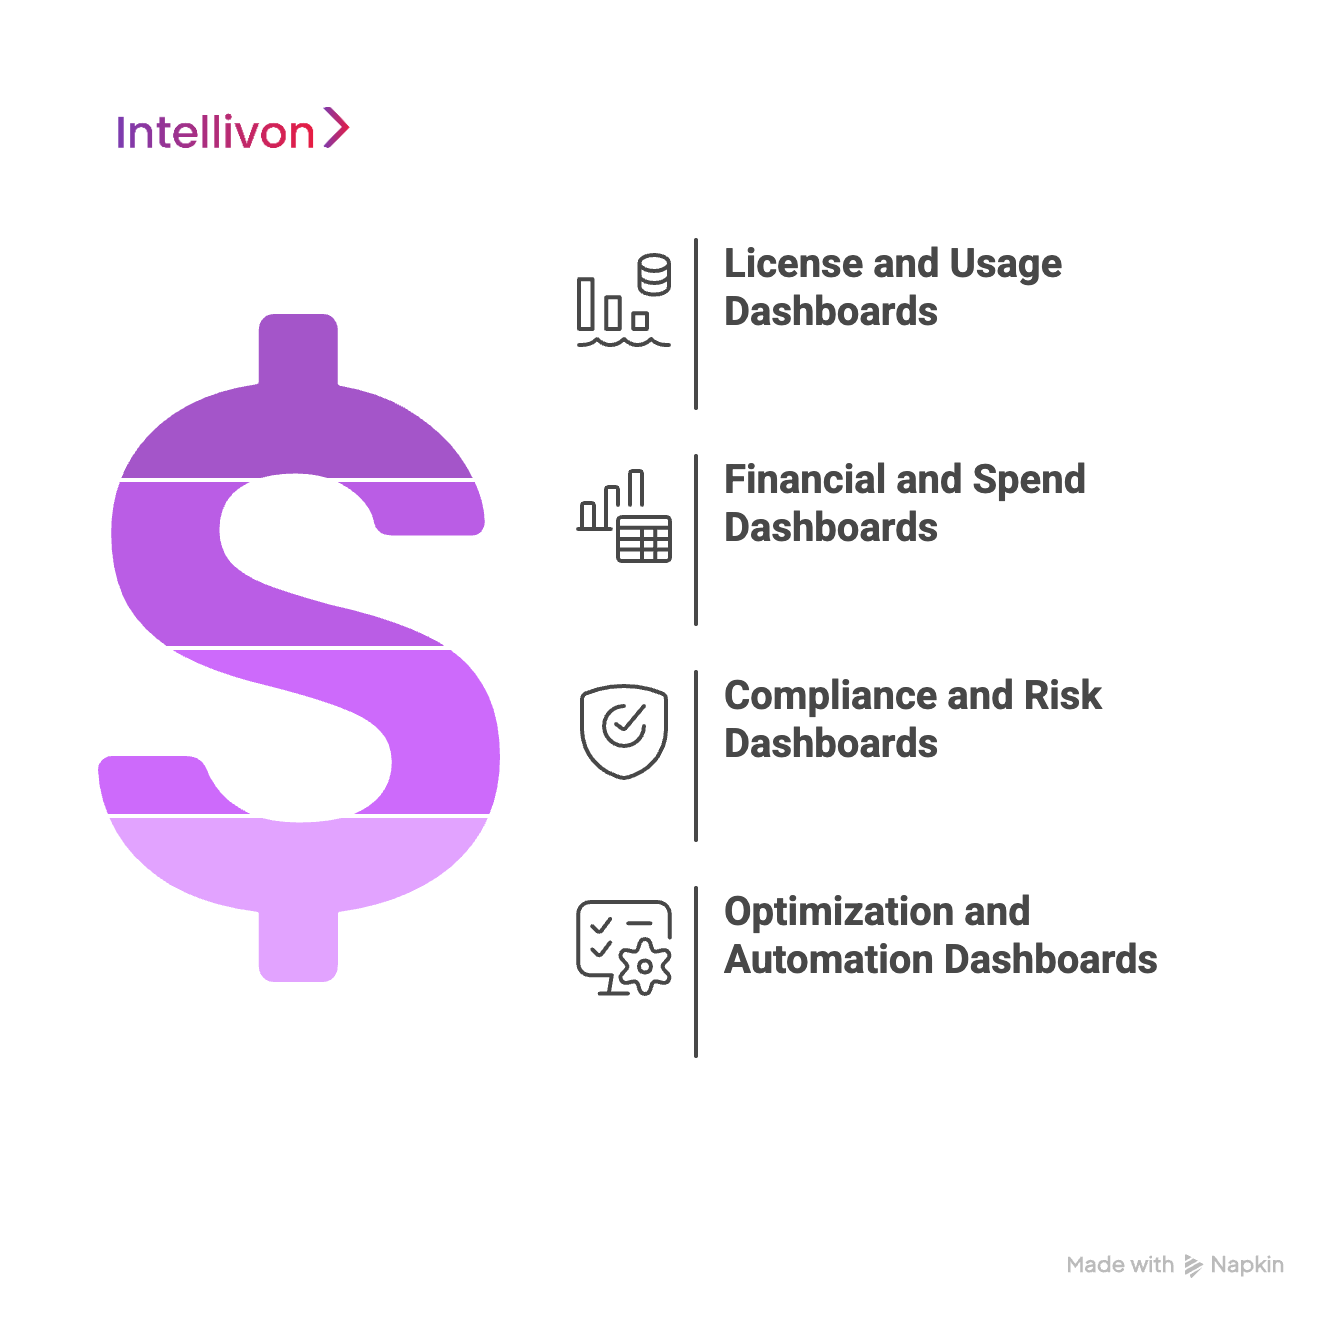
1. License and Usage Dashboards
These dashboards track how licenses are being consumed across the enterprise. They reveal inactive accounts, underused premium tiers, and duplicate seat allocations. IT teams rely on them to ensure that purchased capacity matches actual adoption.
Example: Deloitte uses Microsoft 365 Admin dashboards to reassign unused seats across global offices, preventing millions in overspend.
2. Financial and Spend Dashboards
Designed for finance and procurement teams, these dashboards consolidate invoices, renewal schedules, and departmental allocations into a single view. They make it easier to forecast budgets, spot sudden spikes, and enforce accountability across cost centers.
Example: Adobe leverages Apptio Cloudability to break down SaaS spend by project and department, enabling stronger negotiation leverage during renewals.
3. Compliance and Risk Dashboards
For security and compliance leaders, dashboards provide visibility into shadow IT and vendor certifications. They flag apps that lack SOC 2, HIPAA, or GDPR readiness and expose purchases made outside approved procurement channels.
Example: Nike uses Zylo dashboards to identify unsanctioned SaaS tools in expense reports, ensuring every vendor meets security standards before renewal.
4. Optimization and Automation Dashboards
The most advanced dashboards go beyond reporting and act on the anomalies they detect. These systems trigger workflows such as auto-reclaiming licenses from churned employees, sending contract renewal alerts, or blocking unapproved purchases.
Example: Uber deploys Productiv dashboards to monitor engagement at the team level and approve optimization actions instantly, while Delivery Hero uses Torii automation to revoke licenses during offboarding.
While many enterprises use these dashboards in isolation, the real value comes from integrating them into a single governance layer. At Intellivon, we design platforms that combine license visibility, financial discipline, compliance monitoring, and automation into one enterprise-grade solution. This not only cuts waste but also embeds governance directly into daily operations, making SaaS cost control continuous rather than reactive.
How These Cost Governance Dashboards Work in Enterprises
Behind every effective SaaS cost governance dashboard is a structured workflow that brings scattered data under one roof and makes it actionable. Enterprises mostly struggle with the fragmentation of their data and with its absence. These dashboards are designed to bridge those gaps and turn disjointed information into clear decision-making intelligence.
Step 1: Data Aggregation
The process begins by connecting finance, IT, and SaaS vendor systems. Dashboards pull invoices from ERP platforms, license data from SaaS APIs, and user information from identity management tools such as Okta or Active Directory. This creates a unified foundation for analysis.
Step 2: Identity Mapping
Once the data is collected, dashboards map SaaS licenses to individual users. This step exposes inactive accounts and ensures that employees who have left the organization no longer hold paid seats.
Step 3: Spend Allocation
Costs are then assigned to departments, cost centers, or regions. This accountability makes it clear who owns each portion of SaaS spend and prevents cost overruns from being treated as a shared IT problem.
Step 4: Compliance Monitoring
Dashboards check whether SaaS vendors align with security and regulatory standards. They also surface shadow IT, which are apps purchased outside approved channels. With these insights, enterprises reduce risk before it turns into an audit or breach issue.
Step 5: Optimization
Usage data is compared with spend to highlight inefficiencies. Dashboards recommend license downgrades, vendor consolidations, or contract renegotiations that can unlock immediate savings.
Step 6: Automation
Finally, advanced dashboards embed automation. They can trigger workflows to auto-reclaim unused licenses, send renewal alerts, or block unapproved purchases. This ensures governance is not only visible but also continuous.
When implemented correctly, SaaS cost governance dashboards move enterprises from reactive cost tracking to proactive cost control. By linking data across finance, IT, and compliance, they provide a complete picture of SaaS usage and spending.
Core Features of a SaaS Cost Governance Dashboard
A SaaS cost governance dashboard earns its value from the features it brings together. Enterprises need a system that links usage, spend, compliance, and optimization into one source of truth. Below are the capabilities that define a mature platform.
1. Unified SaaS Inventory
The starting point is visibility. A unified inventory consolidates every application in use across the enterprise, including those acquired through expense claims or credit cards. This eliminates duplication, creates a single source of truth, and gives leaders a clearer picture of how fragmented their SaaS ecosystem really is.
2. License Utilization Tracking
Licenses are often purchased in bulk, but many sit idle. Utilization tracking connects each license to an individual user and reveals whether premium tiers are actually being adopted. By surfacing inactive accounts or unused features, enterprises can reassign, downgrade, or remove seats before renewals lock in wasted costs.
3. Spend Analytics and Allocation
Dashboards also make SaaS spend accountable. Instead of one large number on the balance sheet, costs are mapped to departments, cost centers, or geographies. This clarity allows finance to see exactly where budgets are going, while business units take ownership of their own consumption.
4. Renewal Calendars and Alerts
Few issues drain budgets faster than missed renewal dates. With many vendors embedding price uplifts into auto-renewal clauses, oversight is expensive. Renewal calendars with 90/60/30-day alerts give procurement time to negotiate terms, compare alternatives, or consolidate contracts, rather than being forced into last-minute renewals.
5. Compliance and Risk Monitoring
Compliance leaders benefit from knowing which vendors meet critical certifications such as SOC 2, GDPR, or HIPAA. Dashboards surface these insights in real time and flag shadow IT purchases before they become audit risks. This reduces the chance of costly remediation and strengthens overall governance.
6. Optimization Recommendations
Beyond reporting, dashboards should provide direction. By comparing spend against actual usage, they recommend actions such as consolidating redundant tools, renegotiating contracts, or downgrading underused seats. These recommendations turn SaaS governance into a continuous improvement process rather than a reactive clean-up exercise.
7. Automation and Role-Based Views
The final layer is automation. License reclamation during employee offboarding, automated renewal reminders, or even blocking unapproved purchases can all run in the background. Role-based dashboards ensure finance, IT, compliance, and business leaders each get the insights relevant to them, without being distracted by noise.
When brought together, these features transform a dashboard from a reporting utility into an enterprise governance system. They create discipline around SaaS usage, deliver measurable cost savings, and reduce compliance exposure, all while giving business leaders the confidence that their software investments are under control.
Architecture of SaaS Cost Governance Dashboards
A SaaS cost governance dashboard is only as strong as the architecture behind it. For large organizations, the challenge isn’t a lack of data but the complexity of connecting finance, IT, and vendor systems into one coherent model. At Intellivon, we approach this by designing architectures that are both scalable and resilient, ensuring that enterprises can move from fragmented data to actionable intelligence without disruption.
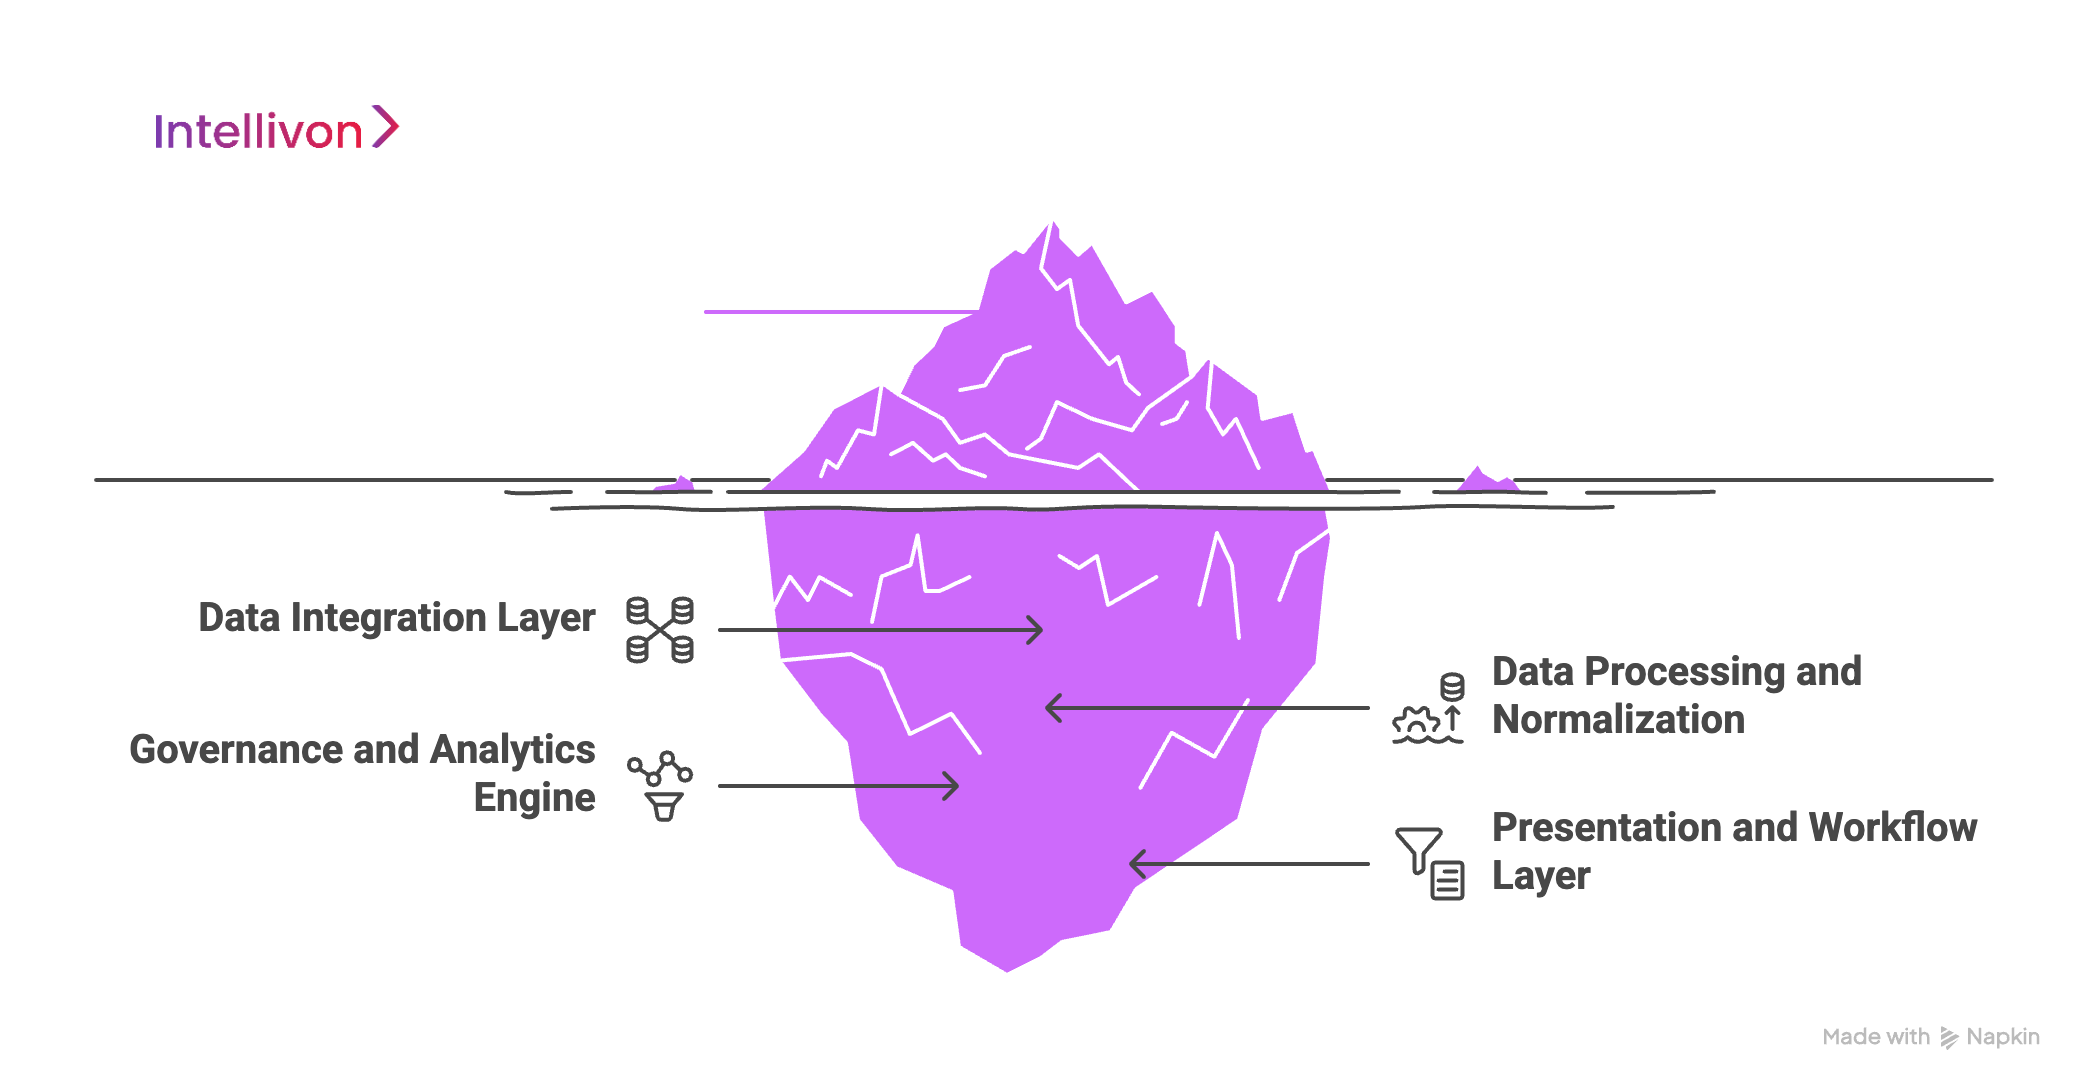
1. Data Integration Layer
The foundation begins with integration. Dashboards must connect seamlessly to ERP and procurement systems for invoices, identity management platforms such as Okta or Active Directory for user data, and SaaS APIs for license and usage details. At Intellivon, we also build connectors into expense management and corporate card systems to capture shadow IT spend, giving enterprises the complete picture they often lack.
2. Data Processing and Normalization
Raw data is rarely consistent. Vendors appear under different names, invoices vary in format, and user accounts often don’t align across systems. Our processing layer resolves this by normalizing data, mapping licenses to users, reconciling vendor records, and categorizing spend by department or region. The result is a clean dataset that executives can rely on for decision-making.
3. Governance and Analytics Engine
Once the data is stable, the governance engine applies intelligence. It compares license purchases with actual usage, flags shadow IT, highlights compliance risks, and generates recommendations for optimization. Intellivon’s analytics framework also includes forecasting models, showing enterprises the savings and risk reduction possible under different scenarios. This transforms dashboards from static reporting tools into strategy enablers.
4. Presentation and Workflow Layer
Finally, the architecture delivers insights through role-based dashboards, automated alerts, and embedded workflows. Finance sees spending and budgeting trends, IT tracks license adoption, compliance monitors vendor risk, and business units view their own allocations. With automation built in, licenses are reclaimed during offboarding, renewal alerts are triggered ahead of deadlines, and purchase approvals are routed directly into collaboration tools.
The real challenge for enterprises is ensuring that finance, IT, and compliance all operate on the same source of truth. Intellivon’s architecture combines data pipelines, governance intelligence, and automated workflows. We deliver systems that give leaders confidence that their SaaS investments are visible, optimized, and fully under control.
What SaaS Costs Do These Dashboards Actually Cover
One of the most important questions enterprises ask is what costs a governance dashboard will actually reveal. At first glance, it may seem like SaaS costs are limited to subscription fees and renewals. In practice, the financial footprint runs far deeper, often hidden across departments, payment methods, and vendor contracts.
1. Subscription and License Fees
The most visible cost is the recurring subscription itself. The dashboards track how many licenses were purchased versus how many are truly active. By exposing unused or underused seats, organizations prevent money from leaking out of their budgets every billing cycle.
2. Add-Ons and Feature Upgrades
Many SaaS vendors bundle premium features into separate add-ons. These often go underutilized. A dashboard makes it clear which add-ons are being adopted and which can be safely removed without affecting business operations.
3. Redundant Applications
Large organizations often discover that they are paying for multiple tools that serve the same purpose, such as three project management platforms in different regions or multiple survey tools across departments. Dashboards highlight these overlaps and make the case for consolidation.
4. Shadow IT Spend
Not all SaaS spend flows through procurement. Employees purchase tools with corporate cards or submit expense claims, creating blind spots. Dashboards that integrate financial feeds capture these transactions and surface them for review, bringing hidden spend under governance.
5. Renewal and Contract Costs
Auto-renewals and contract uplifts are common. Without visibility, enterprises often roll into higher rates by default. Dashboards bring renewal schedules into one place, providing alerts well ahead of deadlines so teams can renegotiate terms or reconsider vendors.
6. Integration and API Charges
For data-heavy organizations, API overages and integration fees can become a major line item. Dashboards track these variable costs alongside subscription fees, ensuring leaders understand the full cost of using a platform.
7. Premium Support and Services
Vendors frequently charge for enhanced support tiers. Dashboards link support spend to actual ticket volumes, making it easier to evaluate whether the premium package is justified or whether standard support is enough.
8. Compliance and Risk Exposure
While not a line item on an invoice, compliance gaps can create financial risk. Dashboards highlight vendors lacking certifications such as SOC 2, GDPR, or HIPAA, allowing leaders to factor potential penalties or remediation costs into decision-making.
9. Employee Churn Waste
Licenses left active after employees leave are one of the most persistent hidden costs. By connecting with HR systems, dashboards automatically flag these accounts and make reclamation part of the offboarding process.
10. Regional and Currency Variations
For global enterprises, the same SaaS tool can cost different amounts depending on region or currency. Dashboards normalize spend across geographies, ensuring comparisons are accurate and procurement can negotiate consistent global rates.
When all of these cost layers are captured in one place, enterprises finally gain a complete picture of their SaaS ecosystem. This visibility is what turns dashboards from a reporting tool into a financial control system. By surfacing not only subscription fees but also hidden add-ons, redundancies, and compliance risks, they allow leaders to make decisions with confidence and precision.
Our Step-by-Step Development Framework For Cost Governance Dashboards
At Intellivon, we’ve seen firsthand that building a SaaS cost governance dashboard is about creating a governance system that aligns with enterprise goals, cleans fragmented data, and scales with business growth. Over the years, we’ve developed a structured framework that ensures these dashboards deliver measurable impact from day one.
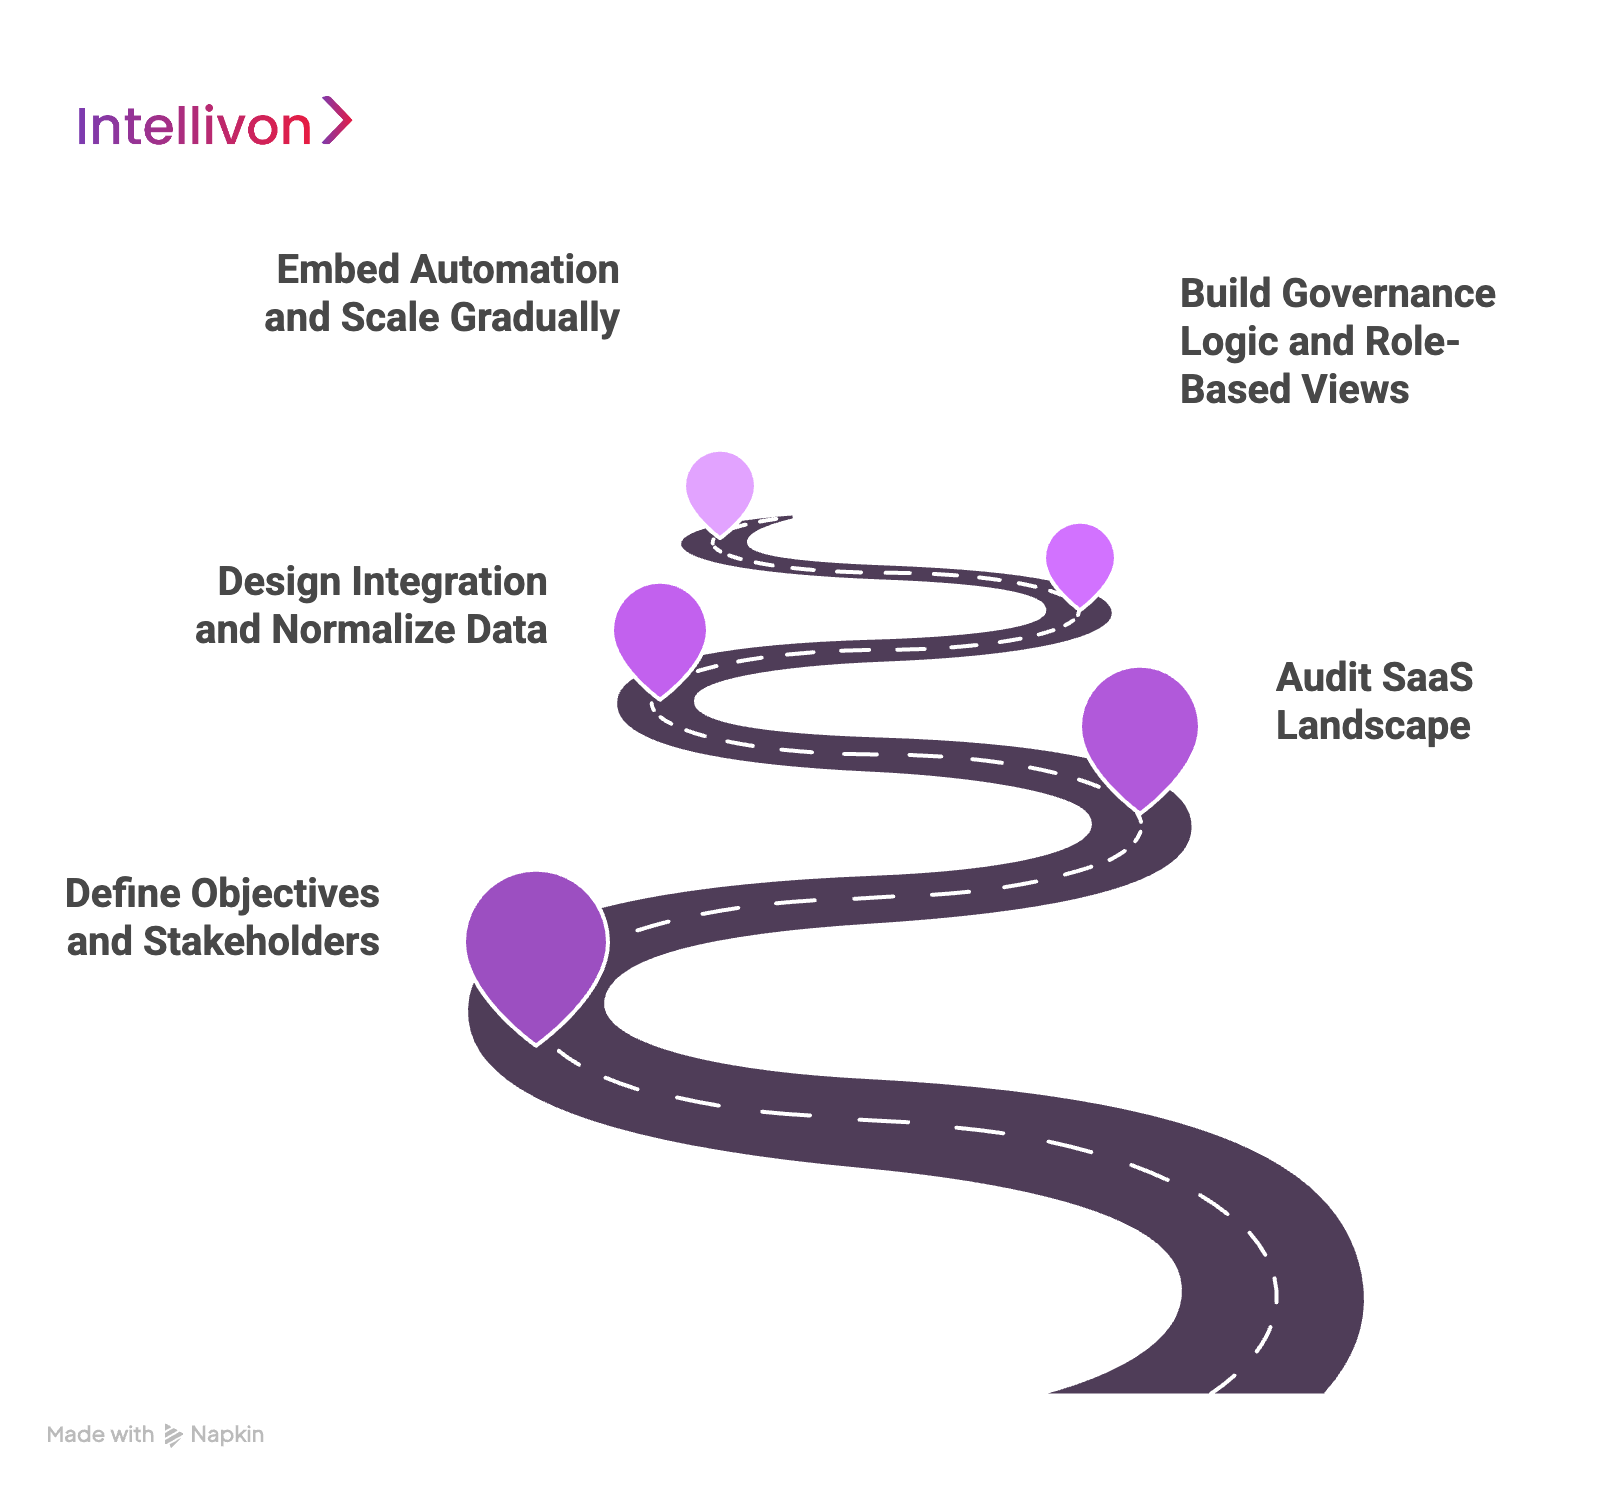
Step 1: Define Objectives and Stakeholders
We begin by aligning on goals. For some enterprises, the priority is immediate cost reduction, while for others, it’s compliance or accountability. Our process brings finance, IT, procurement, and compliance leaders together early, so the dashboard is designed for the whole enterprise, not just one team.
Step 2: Audit the SaaS Landscape
Next, we map the entire SaaS footprint. This audit includes both sanctioned tools and shadow IT buried in expense reports or card transactions. In many cases, this is where clients discover their first quick wins, like redundant platforms, unused licenses, and vendors nobody knew they were paying for.
Step 3: Design Integration and Normalize Data
Once the landscape is clear, we design the integration layer. Our dashboards connect directly to ERP systems, identity platforms, SaaS APIs, and expense feeds. Because data from these sources is rarely consistent, we then normalize it by mapping licenses to users, standardizing vendor names, and aligning spend with departments or regions. This is what makes the data trustworthy.
Step 4: Build Governance Logic and Role-Based Views
With clean data in place, our governance engine applies intelligence. It compares licenses against usage, flags compliance risks, and surfaces optimization opportunities. To ensure insights are actionable, we design role-based dashboards tailored to finance, IT, compliance, and business leaders, each receiving the information they need in a format they can act upon.
Step 5: Embed Automation and Scale Gradually
Finally, we embed automation to make governance continuous. Licenses are reclaimed during offboarding, renewal alerts are triggered months in advance, and unapproved purchases are blocked automatically.
We then pilot the dashboard with select departments, refine based on feedback, and scale it across the enterprise. This phased rollout ensures adoption is high and results are measurable.
This framework is the result of building dashboards for some of the most complex SaaS environments. Clients who follow it with us typically see double-digit savings in their first quarter, gain full audit readiness, and cut renewal effort in half. Most importantly, the platform becomes the system of record for managing it.
Cost to Build a SaaS Cost Governance Dashboard
At Intellivon, we understand that enterprises need SaaS cost governance platforms that are both secure and cost-effective. That’s why our pricing model is flexible and aligned with your requirements, not a one-size-fits-all package.
If costs risk exceeding your planned budget, we work with you to refine the scope while protecting the core value of savings, compliance, and operational efficiency.
Estimated Phase-Wise Cost Breakdown
| Phase | Description | Estimated Cost Range (USD) |
| Discovery & Strategy Alignment | Requirement gathering, stakeholder interviews, KPI mapping, SaaS audit | $6,000 – $10,000 |
| Architecture & Data Design | Platform blueprint, data pipelines, SaaS API mapping, HR/Finance/SSO interoperability planning | $8,000 – $14,000 |
| Core Feature Development & Integration | License tracking, spend allocation, compliance monitoring, vendor renewal logic | $12,000 – $20,000 |
| Platform Development & Customization | Dashboards, renewal calendars, departmental cost allocation, spend analytics views | $14,000 – $22,000 |
| Security & Compliance Alignment | Encryption, role-based access, audit trails, compliance validation (GDPR, HIPAA, SOX) | $6,000 – $12,000 |
| Testing & Validation | Accuracy checks, simulation of renewal scenarios, performance tuning | $6,000 – $12,000 |
| Deployment & Scaling | Cloud rollout, regional data residency setup, enterprise integration, monitoring dashboards | $5,000 – $10,000 |
Total Initial Investment Range: $50,000 – $100,000
Ongoing Optimization (Annual): $5,000 – $12,000
Factors That Influence Cost
- Integration Depth: Number and complexity of SaaS APIs, HR systems, finance tools, and procurement platforms.
- Feature Scope: From essential dashboards and reporting to advanced optimization engines and automation workflows.
- Regulatory Requirements: Coverage for GDPR, HIPAA, SOX, and data residency obligations across jurisdictions.
- Deployment Model: Cloud-native, hybrid, or on-premises options based on enterprise security posture.
- Customization Needs: Pre-built modules for rapid rollout vs. bespoke workflows for global business units.
- Advanced Capabilities: Predictive analytics, AI-powered renewal negotiation, global-scale reporting, and multi-language support.
Request a tailored quote from Intellivon today, and we’ll design a SaaS cost governance dashboard that fits your budget, enforces compliance, and scales with your organization’s growth.
Challenges in Deploying Cost Governance Dashboards (and How We Solve Them)
Building a SaaS cost governance dashboard is rarely a straightforward project. The complexity of enterprise systems, data inconsistency, and cultural resistance can all limit impact if not addressed upfront. Below are the most common challenges we see in large organizations, and how Intellivon helps solve them.
1. Identity and License Mapping
In most enterprises, employees hold multiple accounts across systems due to mergers, HR changes, or regional setups. This creates “identity drift” where one person appears as three users. Without resolving this, dashboards flag false inefficiencies and miss true waste.
Intellivon’s approach:
We integrate dashboards with HR systems to establish a canonical ID and reconcile SaaS accounts against it. Automated checks run weekly to capture anomalies, ensuring every license is tied to a single real employee.
2. Vendor Taxonomy Chaos
Invoices, ERP records, and procurement platforms often list the same vendor under different names, such as “SFDC,” “Salesforce.com,” or “Salesforce Inc.” This leads to double-counting and missed renewal alerts.
Intellivon’s approach:
We build a master vendor dictionary into the architecture, automatically normalizing records at ingest. This creates a single, clean vendor view and prevents duplication.
3. Renewal Traps and Auto-Renewals
Many SaaS contracts include auto-renewal clauses with built-in uplifts. Without visibility, organizations roll into costly renewals by default.
Intellivon’s approach:
Our dashboards embed renewal calendars with 120/90/60-day alerts and assign business owners to every vendor. This ensures renewals are negotiated proactively, not handled at the last minute.
4. Shadow IT Blind Spots
Employees often expense SaaS tools directly, bypassing IT and procurement. These unsanctioned purchases expose enterprises to compliance and security risks.
Intellivon’s approach:
We integrate dashboards with expense systems and card feeds to surface shadow IT in real time. Spend is classified as sanctioned, unsanctioned, or under review, with automated workflows to route unapproved vendors into procurement.
5. Misleading Adoption Metrics
Many vendors provide only login counts, which can make licenses look active even when adoption is shallow. This leads to poor optimization decisions.
Intellivon’s approach:
We design adoption contracts per application. for example, “hosted two meetings in Zoom” or “created five Salesforce opportunities.” This creates accurate adoption insights and builds trust in optimization recommendations.
6. Governance Without Enforcement
Even with dashboards, purchases often slip through gaps in procurement and card policies. Insights are visible but not acted upon.
Intellivon’s approach:
We embed governance into workflows. SaaS purchases are routed through approved procurement systems, corporate cards are blocked for unapproved vendors, and every app must have a named business owner. Dashboards then serve as the enforcement layer, not just reporting.
At Intellivon, we embed these solutions directly into the dashboards we build. That’s why our clients see not just immediate cost savings but also a long-term cultural shift in how SaaS is managed.
Conclusion
SaaS sprawl isn’t going away. Enterprises will continue adopting new applications as business units innovate, employees seek productivity tools, and vendors push subscription models. But without discipline, this growth translates into waste, compliance risks, and missed opportunities for negotiation.
A SaaS cost governance dashboard changes the dynamic. By unifying spend, usage, and compliance data into a single view, it transforms SaaS from a hidden liability into a managed asset. The organizations that adopt dashboards don’t just reduce waste; they gain a cultural shift where every department is accountable, renewals are handled strategically, and compliance risks are controlled before they escalate.
Build A SaaS Cost Governance Dashboard With Intellivon
At Intellivon, we design enterprise-grade SaaS cost governance dashboards that are secure, compliant, and tailored to the way global organizations operate. Our approach combines deep SaaS integrations, policy-driven automation, and scalable architecture to help you reduce waste, enforce compliance, and maximize ROI, without slowing down innovation.
Why Partner With Intellivon?
Tailored Solutions: Every dashboard is aligned with your unique SaaS stack, governance priorities, and financial objectives.
Compliance-First Design: Built to meet GDPR, HIPAA, SOX, and global audit requirements from day one.
Proven Enterprise Expertise: Our dashboards deliver measurable cost savings, renewal leverage, and stronger IT-finance collaboration across industries.
Scalable Architecture: Cloud-native, API-driven, and integration-ready with HR, finance, procurement, and identity systems.
Actionable Intelligence: More than reporting — dashboards generate optimization recommendations and automate workflows for ongoing governance.
Global Visibility: Multi-currency, region-aware dashboards ensure SaaS costs are normalized and fully transparent worldwide.
Book a discovery call with Intellivon today. Let’s build a SaaS cost governance dashboard that reduces waste, strengthens compliance, and positions your enterprise for long-term cost discipline and digital resilience.
FAQs
Q1. How quickly can enterprises deploy a SaaS cost governance dashboard?
A1. Timelines vary based on complexity, but most clients deploy a functional dashboard within 8–12 weeks, with automation layers added in subsequent phases.
Q2. What systems can these dashboards integrate with?
A2. Dashboards connect with ERP platforms, HR and SSO systems, SaaS vendor APIs, procurement tools, and expense feeds. This ensures both sanctioned and unsanctioned SaaS spend is captured.
Q3. How do dashboards handle data privacy and security?
A3. They are built with enterprise-grade security, like encryption, role-based access, audit trails, and compliance validation for regulations such as GDPR, HIPAA, and SOX.
Q4. Do dashboards work globally across regions and currencies?
A4. Yes. They normalize data across geographies, factoring in local pricing, FX fluctuations, and regional compliance requirements.
Q5. What ROI can enterprises expect?
A5. Clients typically recover their investment within the first year, often within the first quarter, through reclaimed licenses, prevented renewals, and vendor consolidations. The long-term benefit is cultural: SaaS management becomes proactive, not reactive.