Healthcare providers are overwhelmed with data but lack useful insights. Most organizations collect millions of patient interactions each year, including claims, encounters, lab results, and social determinants. However, when leadership asks questions like “Which patient groups are causing readmissions?” or “Where should we focus our next care management initiative?” teams struggle with scattered systems and provide answers that are often outdated by the time they’re shared.
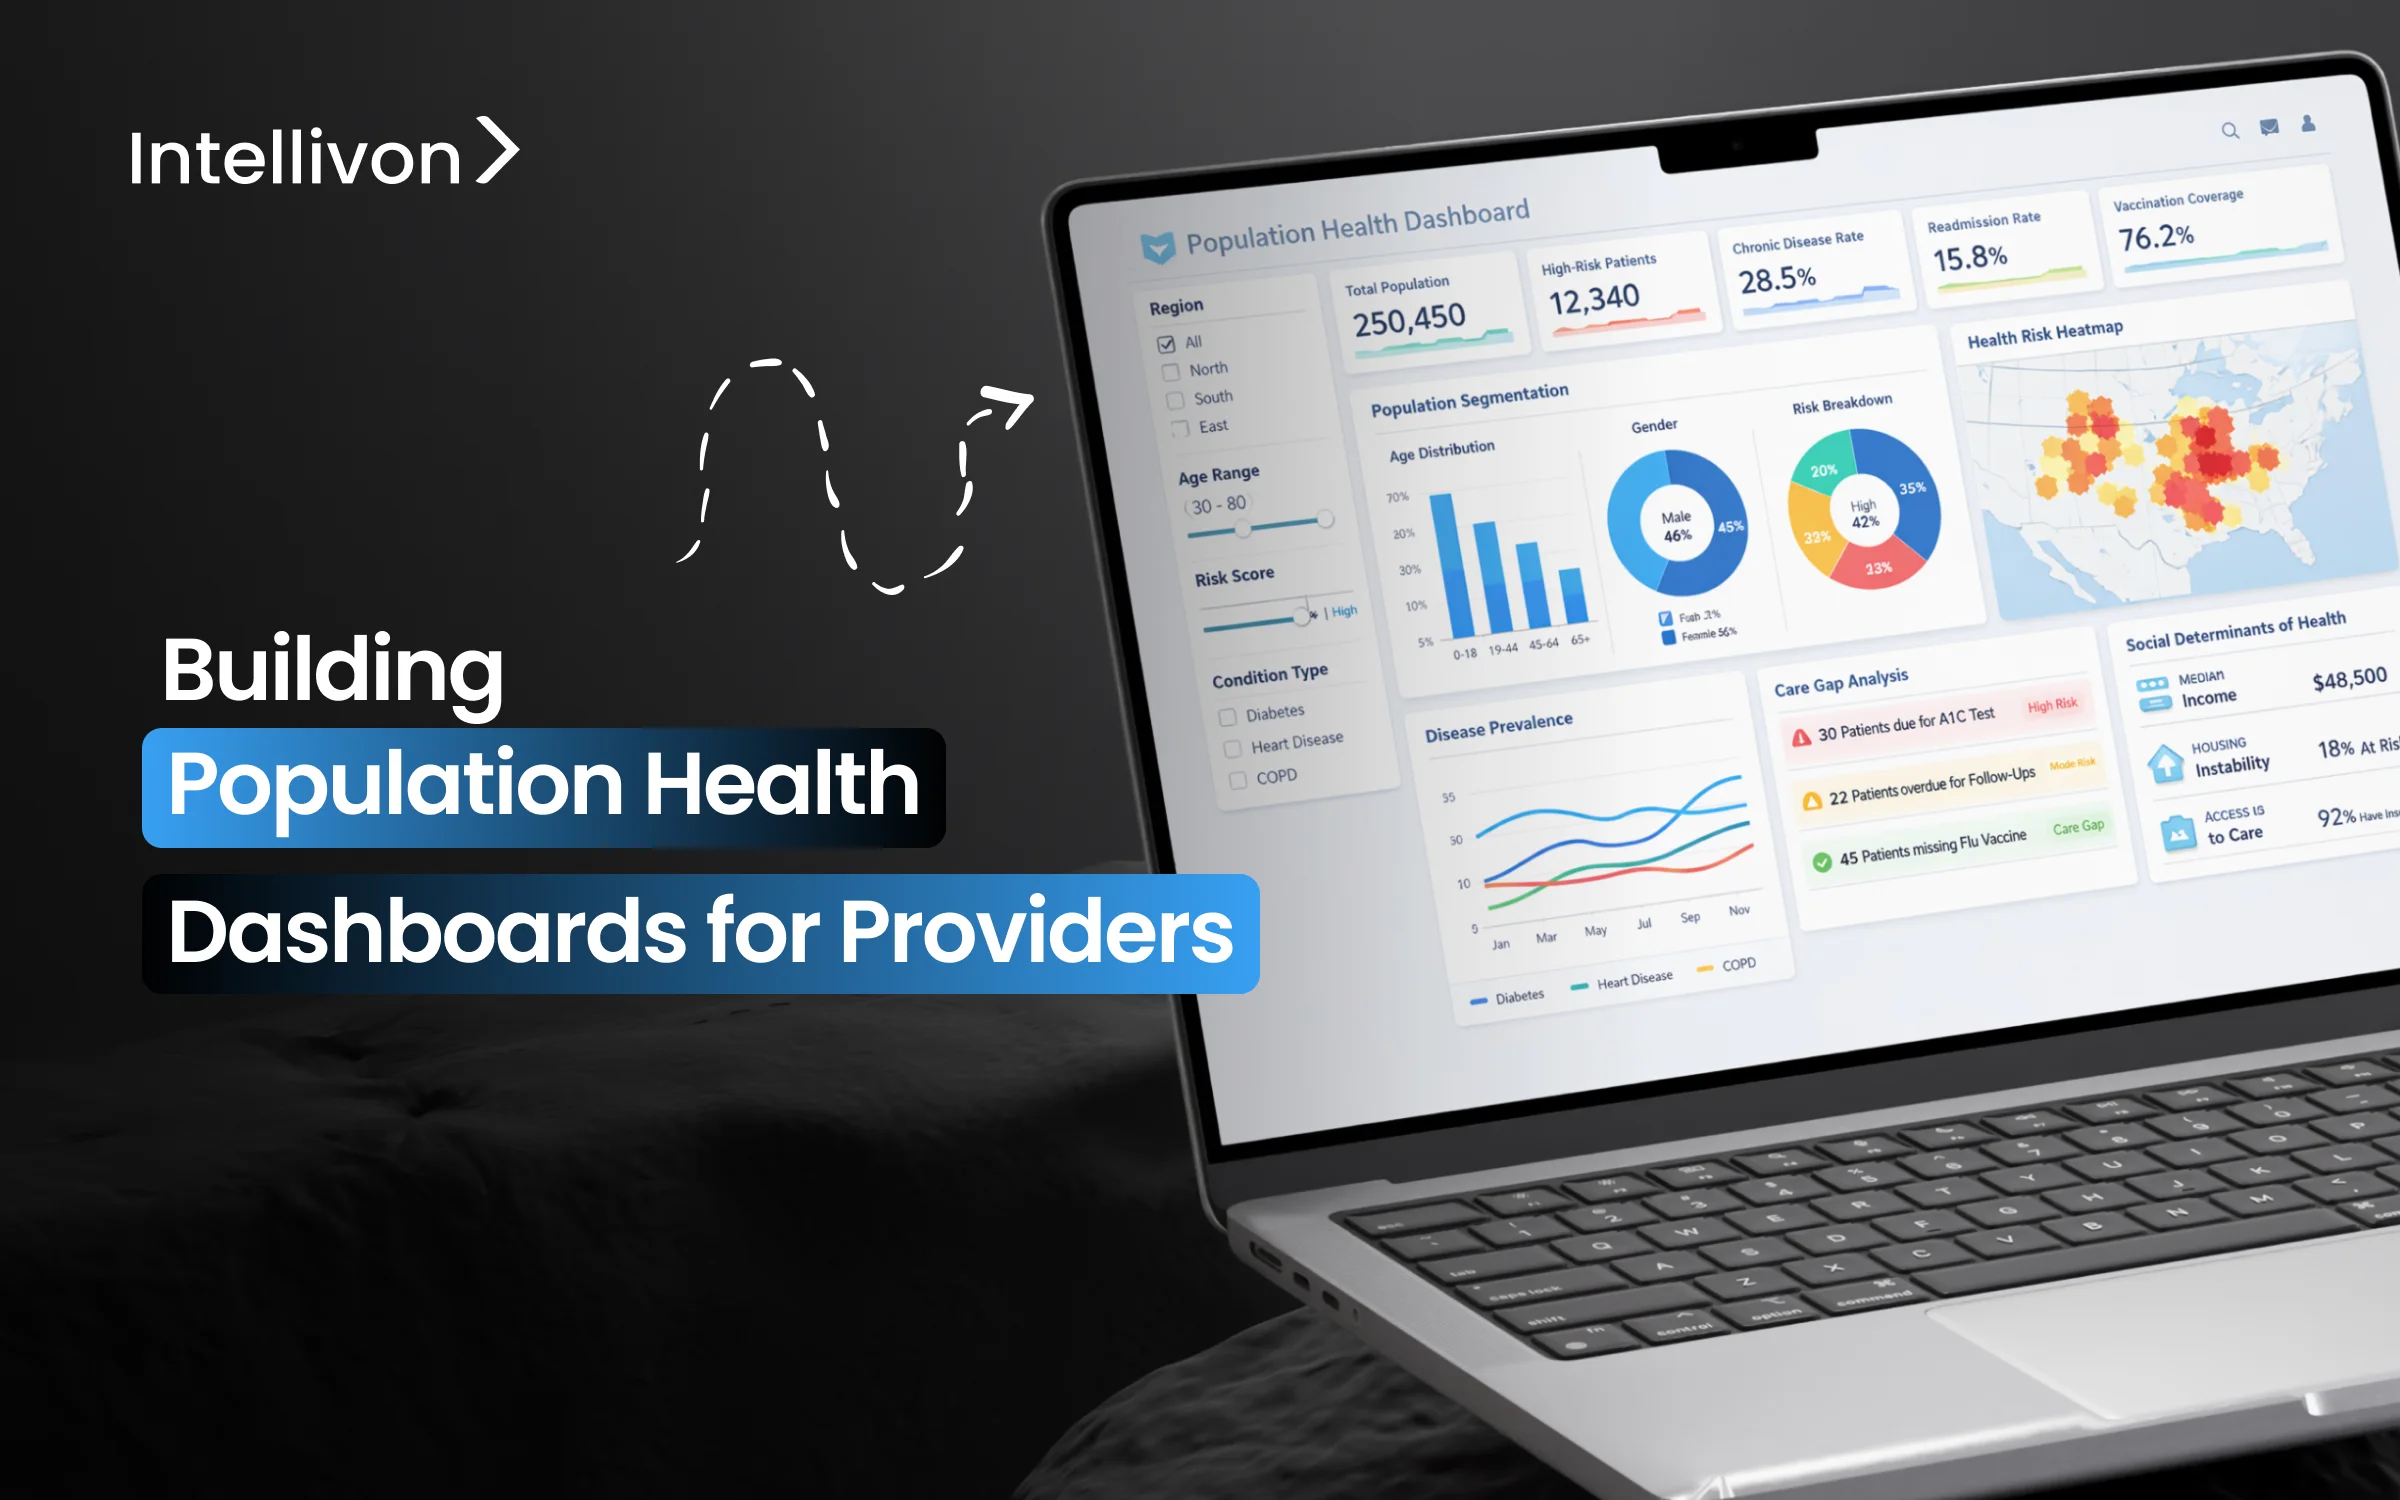
Organizations that outperform others take a different approach. They use population health dashboards that bring together various data sources into one view. Instead of relying on static quarterly reports, clinical leaders and care coordinators receive real-time information right when decisions need to be made. Here, high-risk patients are identified automatically, care gaps are visible across entire populations, and risk assessment is ongoing.
When designed well, these dashboards change how health systems find risks, allocate resources, and manage population segments that can be worth millions in value-based contracts. At Intellivon, we create these intelligence platforms for health systems and payer organizations around the world. This blog explains how we build these and our implementation strategy that produces results in months, not years.

Why Population Health Dashboards for Providers Matter
Population Health Dashboards are central to modern population health management. They give providers real-time insight into patient risk, outcomes, and resource use across large populations. Instead of waiting for delayed reports, teams can act while interventions still make a difference. As value-based care expands and AI tools improve prediction, these dashboards support earlier decisions and better cost control.
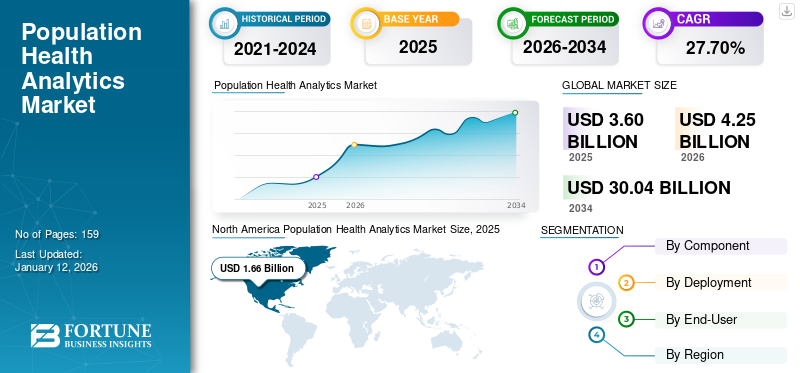
Therefore, Population Health Dashboards for Providers matter because they directly influence performance, financial stability, and long-term growth. The global population health analytics market was valued at USD 3.60 billion in 2025. It is expected to grow to USD 4.25 billion in 2026 and reach USD 30.04 billion by 2034. This reflects a strong compound annual growth rate of 27.70% during the forecast period.
Market Growth Drivers:
- Value-based care requirements and rising chronic disease rates are increasing demand for predictive dashboards.
- Cloud-based deployment held the largest market share in 2024. Organizations prefer it because it offers scalability, real-time access, and lower long-term infrastructure costs compared to on-premise systems.
- AI-powered risk insights and intervention tools are accelerating growth, with projected CAGRs between 18% and 28%. In addition, Asia-Pacific markets such as China, growing at 25.4% CAGR, are expanding faster than mature markets like the United States.
Why These Dashboards Matter For Providers
Healthcare economics have shifted. Revenue no longer depends only on patient volume. Instead, performance, outcomes, and cost control shape financial results.
Therefore, providers must manage entire patient populations with precision. Population health dashboards bring financial, clinical, and regulatory performance into one view, helping leadership teams act before risk turns into loss.
1. Value-Based Care Economics
Payment models now reward measurable outcomes. Contracts link reimbursement to quality scores, preventive care rates, and cost efficiency. As a result, organizations must track performance continuously, not quarterly.
Dashboards provide visibility into gaps, trends, and improvement areas so teams can protect revenue and strengthen contract performance.
2. Readmission Penalties and Quality Incentives
Avoidable readmissions directly reduce reimbursement. In addition, quality incentive programs tie bonuses to measurable clinical outcomes.
Without real-time insight, providers react too late. Dashboards help teams identify high-risk patients early and intervene before penalties occur. Therefore, they support both compliance and financial stability.
3. Chronic Disease Cost Burden
Chronic conditions drive the majority of healthcare spending. Diabetes, heart disease, COPD, and hypertension require ongoing management. However, unmanaged cases lead to expensive admissions and emergency visits. Dashboards allow care teams to monitor risk tiers and intervene proactively.
Consequently, they help control costs while improving long-term outcomes.
4. Shared Savings and Downside Risk
Many contracts now include shared savings models or downside risk arrangements. This means providers share financial responsibility when the total cost of care exceeds targets.
Therefore, accurate attribution, utilization tracking, and cost forecasting become critical. Population health dashboards provide transparency into performance against contract benchmarks, reducing financial surprises.
5. Board-Level Performance Reporting
Executive teams and boards expect clear visibility into organizational health. They need concise views of quality metrics, cost trends, and program effectiveness.
Dashboards translate complex clinical and operational data into strategic insights. As a result, leadership can make informed investment and expansion decisions.
In today’s environment, dashboards influence reimbursement and not just reporting. They shape contract performance, risk exposure, and long-term financial sustainability.
What Are Population Health Dashboards for Providers?
Population health dashboards for providers are centralized analytics platforms that help healthcare organizations monitor and manage the health outcomes of defined patient populations.
They combine data from electronic health records, claims systems, and other clinical sources to track risk levels, care gaps, utilization trends, and quality performance.
Instead of focusing on one patient at a time, these dashboards give a broader view across panels, programs, or contracts. As a result, care teams and leadership can identify high-risk groups, improve preventive care, reduce avoidable admissions, and manage financial risk under value-based care models.
Difference Between Population Dashboards vs Clinical Dashboards
Healthcare organizations use many types of dashboards. However, not all dashboards serve the same purpose. Clinical dashboards focus on individual patient care and day-to-day clinical decisions.
In contrast, population dashboards look at groups of patients and long-term performance trends. Therefore, understanding the difference helps leaders invest in the right tools for the right outcomes.
Comparison: Population vs Clinical Dashboards
| Area of Focus | Population Health Dashboards | Clinical Dashboards |
| Primary Goal | Improve outcomes across defined patient groups | Support care decisions for individual patients |
| Data Scope | Aggregated data from EHRs, claims, and other sources | Real-time patient-specific clinical data |
| Time Horizon | Long-term trends and contract performance | Immediate or short-term clinical action |
| Users | Leadership, care managers, quality teams | Physicians, nurses, bedside staff |
| Financial Impact | Linked to value-based contracts and risk models | Focused on clinical quality and workflow efficiency |
| Key Metrics | Risk tiers, care gaps, utilization, cost trends | Lab results, vitals, medications, alerts |
Population dashboards guide strategy and financial planning. At the same time, clinical dashboards guide direct patient treatment. However, they solve different problems. Therefore, providers must align each dashboard type with clear objectives and accountability structures.
Who Uses Population Health Dashboards for Providers
Population health dashboards support multiple teams across a provider organization. They connect clinical insight, financial performance, and operational planning in one system.
Therefore, different leaders rely on them for different decisions. When used correctly, these dashboards create shared accountability and reduce blind spots.
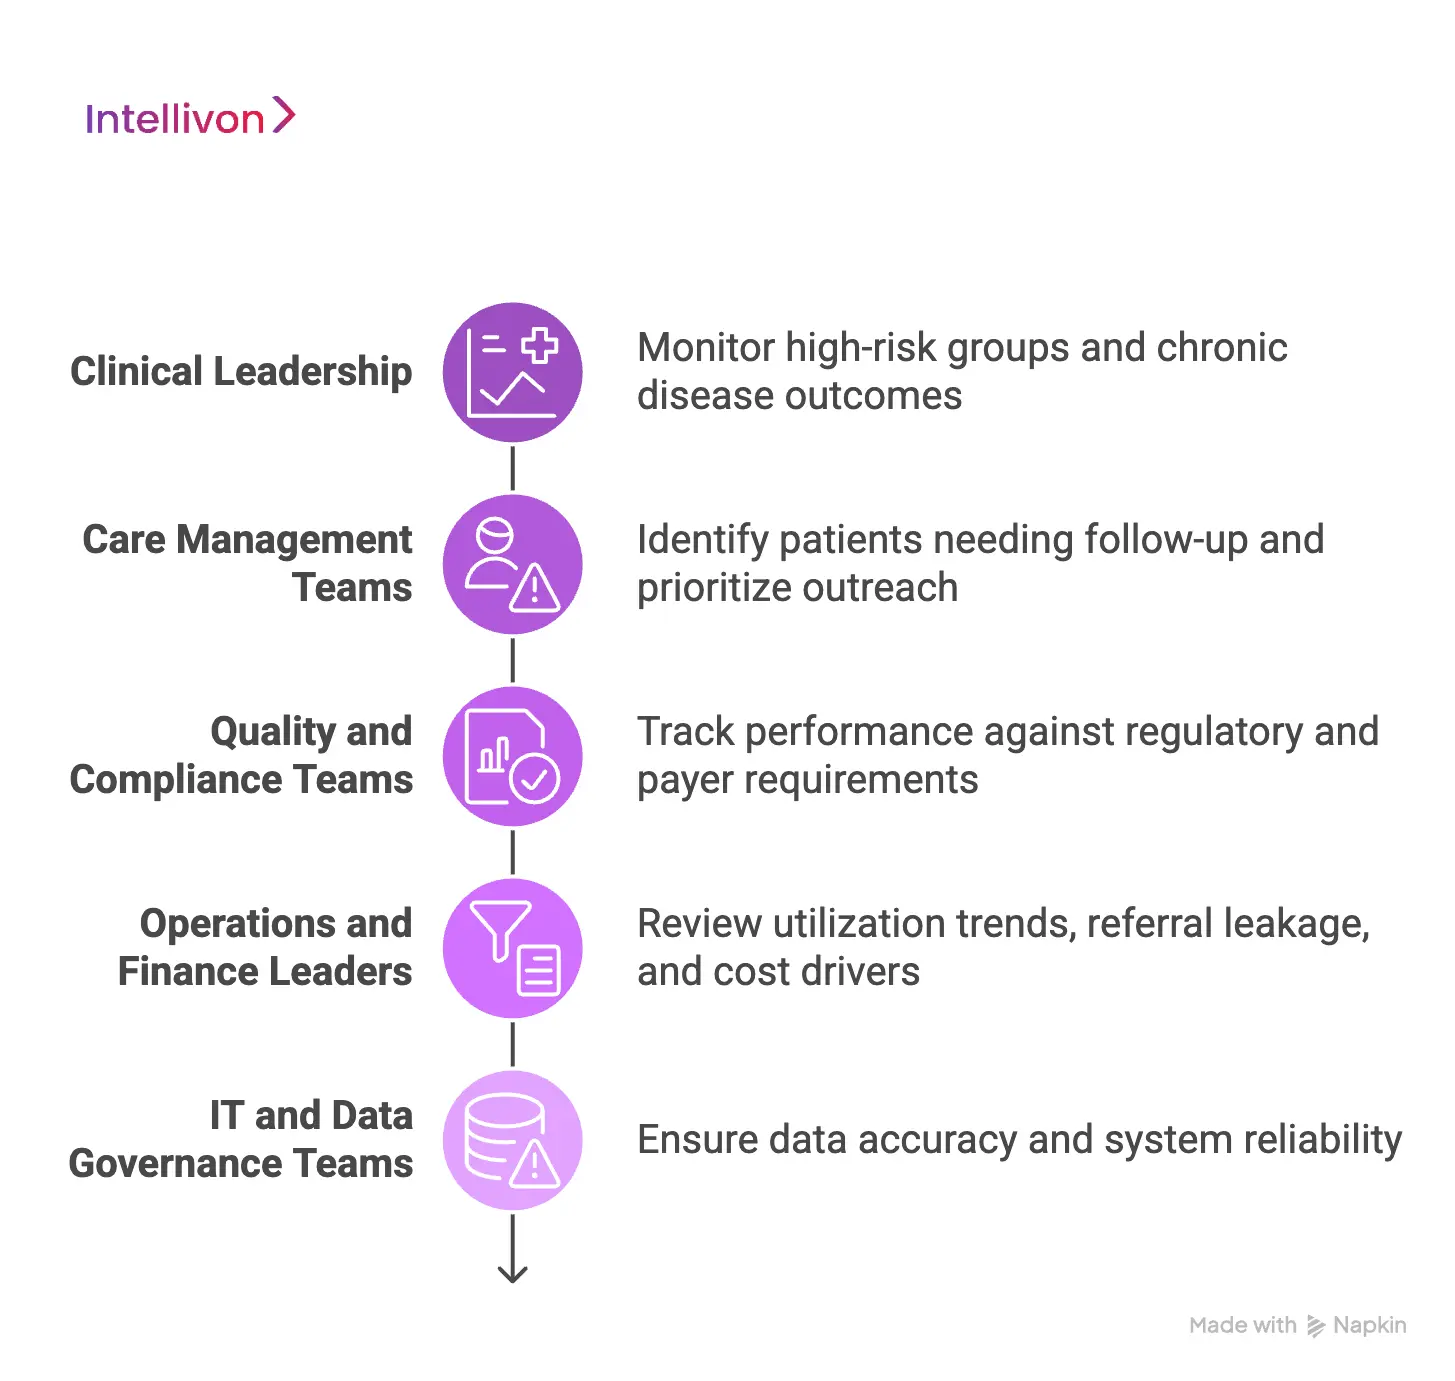
1. Clinical Leadership
Clinical directors and program heads use dashboards to monitor high-risk groups and chronic disease outcomes. They review trends in diabetes control, blood pressure management, and readmission rates.
As a result, they can adjust care protocols and redirect resources where outcomes are declining.
2. Care Management Teams
Care managers depend on dashboards to identify patients who need follow-up. They review risk tiers, care gaps, and missed appointments.
In addition, they use worklists to prioritize outreach. This helps them intervene earlier and prevent avoidable hospital visits.
3. Quality and Compliance Teams
Quality teams track performance against regulatory and payer requirements. They monitor preventive care rates, screening compliance, and contract-based quality measures. Therefore, dashboards help reduce reporting errors and improve audit readiness.
4. Operations and Finance Leaders
Operational teams review utilization trends, referral leakage, and cost drivers. Finance leaders monitor contract performance and shared savings metrics. As a result, they can forecast risk exposure and adjust strategy before losses accumulate.
5. IT and Data Governance Teams
Technology teams ensure data accuracy and system reliability. They monitor integration flows, access controls, and data refresh cycles. In addition, they maintain governance rules so that metrics remain consistent across departments.
Population health dashboards serve as a shared decision platform. Each team views the same core data, yet applies it to different responsibilities. Therefore, adoption across departments strengthens both financial stability and clinical performance
Data Required for Population Health Dashboards for Providers
Population health dashboards are only as strong as the data behind them. Clean visuals mean little if the inputs are incomplete or inconsistent. Therefore, providers must think beyond one system or one data feed.
A reliable dashboard brings together clinical, financial, and operational data in a structured way. When these sources align, leaders gain a full picture of risk, performance, and cost.
1. Clinical Data from EHR Systems
Electronic health records (EHRs) provide the foundation. They include diagnoses, medications, lab results, vital signs, and problem lists. This data helps identify chronic conditions, track disease control, and measure preventive care.
However, documentation gaps can distort results. Therefore, consistent coding and regular validation are essential.
2. Claims and Utilization Data
Claims data shows what happens beyond the primary care visit. It reveals hospital admissions, emergency visits, specialist referrals, and the total cost of care. In addition, it captures services delivered outside the network.
This broader view helps measure utilization trends and contract performance. Without claims data, cost analysis remains incomplete.
3. Event and Encounter Feeds
Admission, discharge, and transfer alerts provide near real-time signals. These feeds help teams respond quickly to hospitalizations or emergency visits.
As a result, care managers can intervene before complications escalate. Timely event data supports proactive population management.
4. Provider and Attribution Data
Accurate panel and attribution data determine which patients belong to which providers or programs. This is critical for performance measurement and risk contracts.
If attribution is unclear, quality scores and cost metrics lose credibility. Therefore, dashboards must reflect transparent and updated panel logic.
5. Social and Community Data
Social factors such as housing stability, transportation access, and income level influence outcomes. When available, this information adds context to risk scores and care plans.
Although not always complete, it helps explain why certain populations require additional support.
Population health dashboards depend on integrated, normalized data from multiple sources. When clinical, claims, event, and attribution data work together, organizations gain reliable insight.
Therefore, investing in strong data foundations ensures the dashboard supports both better care and stronger financial performance.
Attribution Models in Population Health Dashboards for Providers
Attribution models determine which patients are financially and clinically assigned to a provider or contract. Accurate attribution protects reimbursement and prevents performance disputes.
Attribution defines which patients count toward your performance and financial responsibility. It determines whose outcomes affect your quality scores and shared savings calculations. Therefore, if attribution is unclear, reported performance becomes unstable.
1. Primary Care Attribution
This model assigns patients to a primary provider based on enrollment or visit history. It works well in systems with defined panels. At the same time, it supports preventive care tracking and long-term disease management.
However, patients often receive care across multiple sites. As a result, the assignment may change over time. Dashboards must show when and why those changes occur so leadership can trust performance trends.
2. Visit-Based Attribution
Here, patients are assigned to the provider they see most frequently during a set period. Many value-based contracts use this method. It reflects real patient behavior. However, visit patterns can shift quickly.
Therefore, reported outcomes may move from one provider to another between reporting cycles. Without clear tracking, this creates confusion during financial reviews.
3. Payer-Defined Attribution
Some contracts rely on patient lists provided by payers. These lists may update quarterly or annually. They may also differ from internal panel assignments. Consequently, reconciliation becomes necessary.
Dashboards must compare payer attribution with internal records to avoid missed revenue or incorrect performance reporting.
4. Contract-Specific Attribution Rules
Certain agreements apply unique inclusion criteria. These may include minimum visit counts, chronic condition flags, or geographic limits. These rules directly influence shared savings eligibility and downside exposure.
Therefore, dashboards must isolate contract populations and apply the correct logic to each agreement.
5. Attribution Governance and Visibility
Strong dashboards log attribution changes over time. They record assignment dates and rule definitions.
This historical view protects against disputes during audits or payer reviews. In addition, it allows leadership to explain performance shifts with confidence.
Attribution determines who owns outcomes and who absorbs financial risk. Therefore, Population health dashboards must treat attribution as controlled financial infrastructure.
When assignment logic is clear and governed, performance numbers remain credible, and reimbursement remains protected.
Security Controls in Population Health Dashboards for Providers
Security controls in population health dashboards protect patient data, prevent financial exposure, and ensure contract compliance through strict access, monitoring, and audit governance.
At the same time, security directly affects financial stability and regulatory standing. Here, population health dashboards combine clinical, claims, and contract data in one system.
Therefore, weak controls increase the risk of data breaches, compliance penalties, and reputational damage. Strong security design protects both patients and revenue.
1. Role-Based Access Control
Not every user should see the same information. Clinical teams need patient-level detail. Finance leaders may only need contract performance views. Therefore, dashboards must apply role-based access rules.
Access should be limited by:
- Job function
- Program responsibility
- Contract involvement
- Data sensitivity level
This reduces internal risk and ensures compliance with privacy regulations.
2. Minimum Necessary Data Access
Users should only access the data required to perform their role. For example, a care manager may view high-risk patients. However, they may not need access to full financial contract details.
By limiting unnecessary exposure, organizations reduce audit risk and maintain regulatory alignment.
3. Sensitive Data Segmentation
Some patient information requires additional safeguards. Behavioral health records, substance use treatment data, and other protected categories often have stricter privacy requirements.
Therefore, dashboards must segment and protect these datasets separately. This prevents accidental exposure and legal complications.
4. Audit Logging and Activity Monitoring
Every data view, export, and update should be logged. Leadership must know:
- Who accessed the data
- What was accessed
- When it was accessed
This visibility strengthens compliance reporting. In addition, it provides protection during investigations or audits.
5. Data Encryption and Secure Integration
Population health dashboards integrate multiple systems. Data moves between EHRs, claims platforms, and analytics layers.
Therefore, encryption must protect data both in transit and at rest. Secure integration frameworks reduce the risk of interception or unauthorized access.
6. Governance and Ongoing Monitoring
Security controls must evolve as contracts expand and user roles change. Regular access reviews, penetration testing, and policy updates help maintain control. Without ongoing governance, risk slowly increases over time.
Security directly supports financial protection. A breach can trigger penalties, contract scrutiny, and loss of trust.
Therefore, population health dashboards must treat security as operational infrastructure. When controls are strong and monitored, organizations protect patient data, safeguard reimbursement, and maintain executive confidence.
Features Of A Population Health Dashboard For Providers
A population health dashboard must do more than display charts. It should help leadership manage risk, protect reimbursement, and improve care performance.
Therefore, the right features are those that connect clinical activity with financial impact. Below are the core capabilities that matter in enterprise settings.
1. Risk Stratification Engine
The dashboard should identify high-risk and rising-risk patients. It must segment populations into clear tiers based on clinical and utilization data.
As a result, care teams can prioritize outreach and prevent avoidable admissions. For leadership, this supports cost control and proactive intervention planning.
2. Care Gap Identification
The platform should highlight missing preventive services and chronic disease gaps. These may include screenings, medication adherence, or follow-up visits.
When gaps are visible in real time, teams can close them before performance periods end. Therefore, quality scores and incentive payments improve.
3. Utilization and Cost Monitoring
Executives need visibility into emergency visits, readmissions, and specialist referrals. The dashboard should track the total cost of care across attributed populations.
In addition, it should show trends over time. This allows organizations to forecast financial exposure and adjust strategy early.
4. Contract and Performance Tracking
The system must align with value-based contracts. It should display performance against quality benchmarks and shared savings targets. Clear denominator logic and attribution tracking prevent disputes. Consequently, finance teams can review contract results with confidence.
5. Attribution Transparency
Patient assignment must be visible and traceable. The dashboard should show why a patient belongs to a provider or program. When attribution logic is clear, performance reports remain stable. This reduces confusion during payer reviews.
6. Real-Time Event Alerts
Admission and discharge alerts allow teams to act quickly. Early follow-up reduces readmission risk. Therefore, operational responsiveness improves while financial penalties decrease.
A strong population health dashboard connects risk insight with operational action and financial control. Each feature should protect revenue, improve predictability, and support sustainable growth.
When designed correctly, the dashboard becomes a management system, not just a reporting tool.
Advanced AI-Powered Features of a Population Health Dashboard for Providers
AI strengthens a population health dashboard by moving it from tracking performance to predicting risk. Traditional dashboards show what already happened. At the same time, AI-driven features help teams see what is likely to happen next.
Therefore, organizations can intervene earlier, reduce avoidable costs, and improve contract performance. These advanced capabilities support both clinical quality and financial stability.
1. Predictive Risk Modeling
AI models analyze clinical history, utilization patterns, and behavioral signals to predict which patients are most likely to decline. Instead of reacting to hospital admissions, teams can focus on patients whose risk is rising. As a result, early outreach becomes more targeted and effective. This improves outcomes while protecting shared savings opportunities.
2. Next-Best Action Recommendations
AI can suggest specific actions based on patient data. For example, it may recommend medication review, specialist referral, or preventive screening.
These suggestions guide care managers toward practical steps. Therefore, decision-making becomes faster and more consistent across programs.
3. Utilization Forecasting
Advanced models can project future emergency visits, admissions, or high-cost events. Finance and operations leaders gain forward-looking insight rather than historical reports.
This helps with budgeting, staffing, and contract negotiation. Consequently, financial planning becomes more predictable.
4. Automated Care Gap Detection
AI can scan patient records to detect missing services or incomplete follow-ups. It reduces manual review and highlights patterns across large populations.
As a result, quality improvement teams can focus on closing gaps before reporting deadlines.
5. Resource Optimization Insights
AI can analyze workload patterns and intervention outcomes. It helps determine which programs deliver measurable impact and which require adjustment.
Therefore, leadership can allocate staff and funding more effectively.
Advanced AI features transform a population health dashboard into a forward-looking management system. They improve visibility, reduce uncertainty, and support better contract performance.
When combined with strong governance and data quality, AI becomes a practical growth driver rather than a technical experiment.
How We Build Population Health Dashboards for Providers
Building a Population Health Dashboard requires more than connecting data sources. It requires financial discipline, contract alignment, and operational clarity from the start.
At Intellivon, we design these platforms as enterprise systems that support reimbursement stability and long-term growth. Therefore, every design decision ties back to risk control, performance accountability, and scalability.
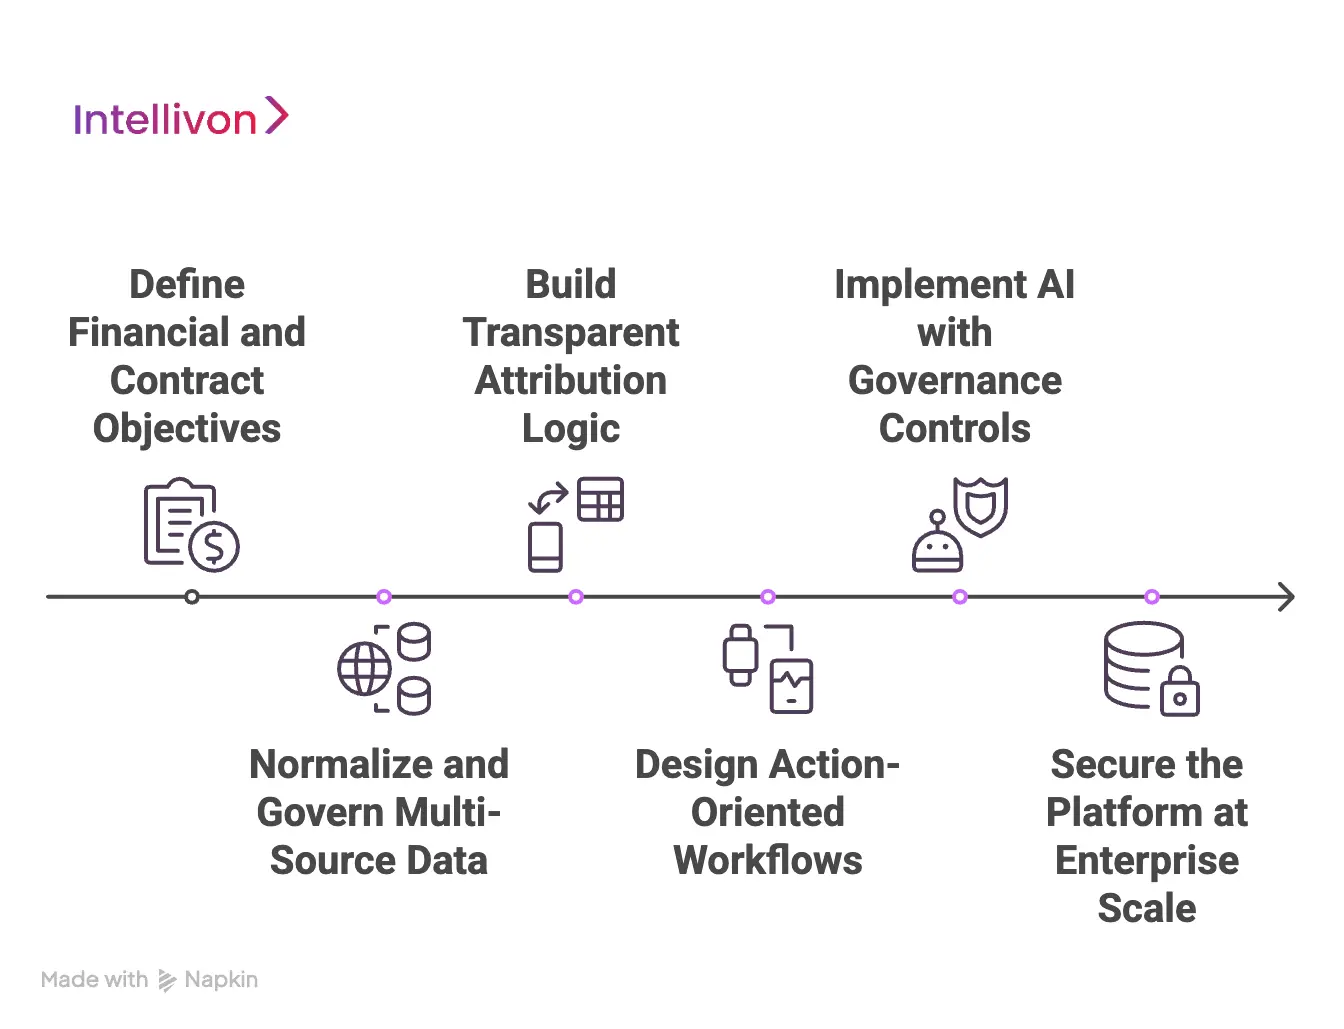
1. Define Financial and Contract Objectives First
We begin by understanding your value-based contracts, shared savings models, and reporting obligations.
This ensures the dashboard reflects how performance is actually measured. As a result, quality metrics, attribution logic, and cost calculations align with real financial exposure.
2. Normalize and Govern Multi-Source Data
We integrate EHR, claims, event feeds, and panel data into a structured data layer. However, integration alone is not enough.
We apply coding alignment, identity resolution, and data validation rules. Therefore, performance metrics remain consistent across departments and reporting cycles.
3. Build Transparent Attribution Logic
Attribution determines revenue and accountability. We implement clear, traceable assignment models that reflect both internal panels and payer-defined lists.
In addition, we log historical changes. This prevents disputes and strengthens executive confidence in performance reporting.
4. Design Action-Oriented Workflows
Dashboards should guide action, not just observation. We configure care gap tracking, risk movement alerts, and intervention worklists.
Consequently, clinical and care teams can respond quickly while leadership monitors measurable impact.
5. Implement AI with Governance Controls
We integrate predictive models for risk scoring and utilization forecasting. However, AI recommendations remain transparent and explainable.
This ensures leadership understands the drivers behind risk projections and intervention priorities.
6. Secure the Platform at Enterprise Scale
Security is built into the architecture. We enforce role-based access, audit logging, encryption, and compliance-ready controls. Therefore, organizations protect patient data while maintaining regulatory alignment.
At Intellivon, we build Population Health Dashboards as controlled, scalable infrastructure. Our approach protects reimbursement, strengthens performance visibility, and supports growth under value-based care.
When designed correctly, the dashboard becomes a strategic control system, not just a reporting interface.
Cost Of Building Population Health Dashboards For Providers
At Intellivon, Population Health Dashboards are built as a governed healthcare performance infrastructure, not as reporting layers added onto existing systems. The focus remains on attribution accuracy, contract alignment, data governance, and long-term financial stability.
When budget constraints exist, the scope is phased carefully. However, attribution logic, measure governance, security controls, and compliance validation are never reduced. Therefore, organizations avoid costly metric disputes and remediation work after launch. Predictability replaces rework, and long-term ROI remains protected.
Estimated Phase-Wise Cost Breakdown
| Phase | Description | Estimated Cost Range (USD) |
| Discovery & Contract Alignment | Value-based contract review, KPI definitions, attribution planning | $6,000 – $12,000 |
| Data Integration & Normalization | EHR, claims, ADT integration, coding alignment, identity resolution | $12,000 – $25,000 |
| Attribution & Measure Governance | Denominator logic, version control, and audit trail setup | $8,000 – $15,000 |
| Backend Development | Risk engines, cohort logic, performance tracking modules | $10,000 – $22,000 |
| Frontend & Role-Based Dashboards | Executive views, cohort dashboards, care manager worklists | $6,000 – $15,000 |
| AI & Predictive Features (Optional) | Risk stratification, utilization forecasting | $5,000 – $15,000 |
| Security & Compliance Controls | Access control, encryption, logging, and validation testing | $6,000 – $12,000 |
| Deployment & Monitoring Setup | Cloud configuration, performance tuning, observability | $5,000 – $10,000 |
Total initial investment: $50,000 – $150,000
Ongoing maintenance and optimization: approximately 15–20% of the initial build annually
Good. I’ll keep this tightly aligned to enterprise concerns: financial control, contract stability, and long-term predictability.
Hidden Costs Enterprises Should Plan For
Even when the initial build fits within a $50,000 – $150,000 range, indirect cost drivers can impact budgets later. Therefore, planning beyond the first deployment phase protects long-term ROI.
1. Expanding Data Integrations
As new clinics, EHR systems, or payer feeds are added, integration complexity increases. Each new source may introduce coding variations and data inconsistencies. Consequently, additional normalization and validation work becomes necessary.
2. Contract and Attribution Changes
Value-based contracts evolve, attribution logic may shift, and quality definitions may change. If the dashboard is not built with version control and flexibility, updates require expensive rework.
3. Regulatory and Reporting Updates
Healthcare reporting requirements continue to evolve. In addition, audits may require new validation processes. Organizations must allocate resources for periodic compliance updates to avoid penalties.
4. Data Quality Monitoring
Data pipelines require ongoing monitoring. Small discrepancies can distort performance metrics. Therefore, continuous validation and reconciliation efforts should be budgeted annually.
5. Infrastructure and Analytics Growth
As patient volume increases, infrastructure demand rises. AI-driven analytics and predictive models may require additional compute resources. Without early planning, scaling costs can surprise finance teams.
6. Change Management and Training
Dashboards influence multiple departments. Training clinical teams, finance leaders, and operational staff requires time and coordination. Adoption efforts often require dedicated support resources.
Ignoring these cost drivers often results in reactive spending later. Planning for them early ensures financial predictability.
Best Practices to Avoid Budget Overruns
Based on Intellivon’s experience delivering enterprise-grade healthcare platforms, certain practices consistently control costs and reduce risk.
1. Define Contract Logic Before Development
Clarify attribution models, denominator rules, and quality metrics before coding begins. This prevents structural changes later.
2. Embed Governance from Day One
Build audit trails, version control, and role-based access into the core architecture. Retrofitting governance later is far more expensive.
3. Use Modular Architecture
Design components that scale independently. Cohort engines, risk models, and reporting layers should evolve without a full redesign.
4. Plan for Multi-Source Data Early
Anticipate future integrations during the initial architecture phase. This avoids expensive structural changes as the organization grows.
5. Monitor Performance and Usage
Track how teams use the dashboard. Identify underused modules early. Therefore, adjustments can be made before operational inefficiencies expand.
5. Align Leadership and Operational Owners
Assign clear accountability for quality measures and cohort outcomes. When ownership is defined, metric disputes decrease, and implementation remains focused.
Request a tailored proposal from Intellivon’s healthcare technology experts to receive a delivery roadmap aligned with your value-based contracts, financial risk exposure, data governance requirements, and long-term population health strategy.
Common Failures in Population Health Dashboards for Providers
Population health dashboards fail because trust erodes over time. Performance numbers begin to shift without a clear explanation. At the same time, different departments interpret results differently, and financial forecasts lose precision.
When leadership cannot defend the numbers in a contract review, confidence declines quickly. Below are the most common breakdown points and how we prevent them.
1. Unstable Attribution
Attribution is often treated as background configuration, yet it determines who owns performance and financial risk. When payer files update or visit patterns shift, patient assignments change. If those changes are not clearly tracked, denominators move quietly, and performance appears inconsistent.
We build attribution as a governed layer within the dashboard itself. Patient assignment rules are documented in simple language, and the system maintains a historical record of when assignments change and why.
Therefore, when leadership reviews performance movement, they can connect it directly to panel updates or payer adjustments rather than assuming deterioration in care quality.
2. Metric Inconsistency
Quality measures frequently drift when governance is weak. One team may calculate a denominator slightly differently from another. Reporting cycles close, and discrepancies surface during executive review. Over time, internal debates consume more energy than performance improvement.
Our experts establish formal measure governance from the beginning. Each metric is clearly defined, assigned an owner, and version-controlled. When definitions evolve due to regulatory updates or contract changes, those updates are logged transparently.
This approach keeps internal reporting aligned with payer submissions and reduces friction across departments.
3. Fragmented Data Foundations
Dashboards that pull from multiple systems without proper normalization often generate unstable trends. Coding differences, identity mismatches, and delayed claims feeds distort performance signals. As a result, risk scores fluctuate, and cost projections become unreliable.
We invest early in structured data alignment and identity resolution. Coding systems are standardized, and validation checks run continuously to detect inconsistencies. This protects cohort logic and ensures that financial forecasts reflect reality rather than data noise.
4. Insight Without Operational Follow-Through
Some dashboards provide detailed trend analysis yet fail to influence daily behavior. Care teams see high-risk populations but lack clear priorities. Leaders review utilization patterns without understanding which interventions are driving change.
We design the platform around action pathways. Risk categories connect directly to care gap queues and intervention workflows.
At the same time, performance views link to operational owners. When a signal appears, there is a defined response attached to it. This creates a measurable impact instead of passive observation.
5. Limited Executive Visibility
In many organizations, dashboards serve operational users but fall short at the strategic level. Board reporting still depends on manual data consolidation.
Financial exposure is evaluated after performance periods close rather than during them.
We ensure that executive-level summaries are embedded within the same system. Contract performance, utilization movement, and downside risk exposure are visible in real time. This allows leadership to adjust strategy before financial consequences materialize.
Population health dashboards fail when they lose credibility. At the same time, credibility weakens when attribution shifts silently, metrics lack ownership, or insights do not translate into action.
Conclusion
Population health dashboards shape reimbursement, financial risk, and long-term performance across provider organizations.
When built with clear attribution, governed metrics, secure controls, and action-driven workflows, they become operational infrastructure rather than reporting tools. Therefore, leadership gains visibility before financial cycles close and can intervene before costs escalate.
With the right foundation, these dashboards protect revenue, strengthen contract performance, and support sustainable growth in a value-based care environment.
Build Population Health Dashboards for Providers With Intellivon
At Intellivon, Population Health Dashboards are built as a governed healthcare performance infrastructure, not as reporting layers added onto existing systems. Every architectural and delivery decision prioritizes attribution accuracy, contract alignment, data governance, and financial risk control. This ensures dashboards operate reliably across providers, payer contracts, care programs, and regulatory environments, not just during initial deployment.
As value-based care programs expand across regions, service lines, and risk models, stability becomes critical. Governance, metric integrity, and audit readiness remain consistent as patient volume and contract complexity increase. Organizations retain control over attribution logic, performance definitions, and financial exposure without introducing fragmentation, reporting disputes, or operational blind spots.
Why Partner With Intellivon?
- Enterprise-grade population health architecture designed for value-based care environments
- Proven delivery across multi-site provider networks and contract-driven performance programs
- Governance-by-design framework with attribution transparency and metric version control
- Secure, modular infrastructure supporting cloud, hybrid, and on-prem deployments
- AI-powered risk stratification and utilization forecasting with full explainability
- Audit-ready performance tracking aligned with payer and regulatory reporting
- Role-based executive and operational views to support real-time decision-making
Book a strategy call to explore how Intellivon can help you build and scale Population Health Dashboards with confidence, control, and long-term enterprise value.
FAQ’s
Q1. What is physician performance analytics?
A1. Physician performance analytics refers to systems that measure clinical quality, productivity, cost, and patient experience at the provider level. These platforms combine EHR, billing, and operational data into structured dashboards. As a result, healthcare enterprises can evaluate performance fairly and consistently across specialties and facilities.
Q2. How do hospitals measure physician performance fairly?
A2. Hospitals measure physician performance using risk-adjusted metrics and specialty-specific benchmarks. They normalize for case complexity, patient demographics, and referral patterns. In addition, they apply clear attribution rules to assign responsibility accurately. Therefore, comparisons remain balanced and defensible.
Q3. Why is risk adjustment important in physician analytics?
A3. Risk adjustment ensures that physicians treating complex patients are not penalized unfairly. Without normalization, raw outcome metrics can misrepresent performance. Consequently, trust declines. When risk models are transparent and specialty-aware, benchmarking becomes credible and adoption improves.
Q4. How do physician performance analytics platforms support value-based care?
A4. These platforms track quality measures, cost variation, and outcome trends tied to contracts. They help organizations monitor readmissions, complications, and utilization patterns. As a result, leadership can intervene early and protect reimbursement under value-based payment models.
Q5. Can physician performance analytics improve operational efficiency?
A5. Yes. Performance analytics highlights workflow bottlenecks, documentation delays, and throughput variation. In addition, it identifies productivity trends and panel imbalances. Therefore, healthcare enterprises can adjust staffing, scheduling, and care pathways to improve efficiency without compromising quality.