Key Takeaways
-
Carbon tracking platforms support Scope 1, 2, and 3 emissions tracking, calculation, and GHG Protocol reporting.
-
ERP and utility integrations, emissions factor databases, and CDP, CSRD, and IFRS S2 compliance are required.
-
AI-powered forecasting, audit trails, and PCAF standards define production-grade carbon tracking infrastructure.
-
Custom enterprise platforms cost $70,000 to $300,000 with annual maintenance at 18 to 25%.
-
How Intellivon builds carbon tracking softwares in 2026 as governed data infrastructure, not a simple ESG reporting dashboard.
Developing carbon tracking software in 2026 costs between $70,000 and $300,000. A single-site platform tracking Scope 1 and 2 emissions lands near the lower end. When you add Scope 3, multi-facility aggregation, and integrations with ERP systems and supply chains, the cost moves toward $300,000. The three variables that drive that range are emission source complexity, facility count, and integration depth.
Here is where teams overspend. When GHG Protocol mappings and TCFD requirements are added after the data layer is built, the Scope 3 engine has to be reconfigured from scratch. That unplanned phase is what pushes carbon software projects over budget. Building the framework into the data architecture from day one eliminates it. In fact, CDP reported that companies using structured carbon disclosure saved over $54 billion from low-carbon initiatives in 2024, which is a return that follows directly from the quality of the underlying data.
Intellivon has spent over a decade building compliance-grade data platforms for healthcare and financial services, always designing framework mappings into the architecture first. In this blog, we break down the full cost by phase: discovery, architecture, data pipeline, AI integration, and maintenance. By the end, you will have a clear budget baseline and know exactly what drives the cost up or down.
![]()
What Is A Carbon Tracking Software Platform?
A carbon tracking software platform collects business activity data, converts it into CO₂e, separates emissions into Scope 1, Scope 2, and Scope 3, and produces reports that sustainability, finance, compliance, procurement, and leadership teams can trust.
For enterprises, this is not a tool that runs once a year at reporting time. It is the operational infrastructure that makes carbon data repeatable, auditable, and usable across investor disclosure, regulatory compliance, and internal reduction planning throughout the year.
1. What The Platform Actually Does
The platform does six things in sequence.
It collects activity data from connected systems, normalizes units and formats, matches each activity to the right emissions factor, calculates CO₂e by scope and source, separates results by site, supplier, entity, and region, and produces dashboards and audit-ready reports.
So, a carbon tracking platform is the operating system behind your carbon accounting program, not just a calculator sitting at the end of it.
2. Why Enterprises Need It Now
Large organizations now need carbon data for investor reporting, supplier qualification, customer procurement, climate risk disclosure, board reporting, and internal decarbonization planning.
The carbon accounting software market is expanding rapidly as enterprises move toward more structured emissions reporting. Grand View Research valued the global market at USD 14.1 billion in 2025 and expects it to rise from USD 16.9 billion in 2026 to USD 67.6 billion by 2033, reflecting a 21.9% CAGR between 2026 and 2033.
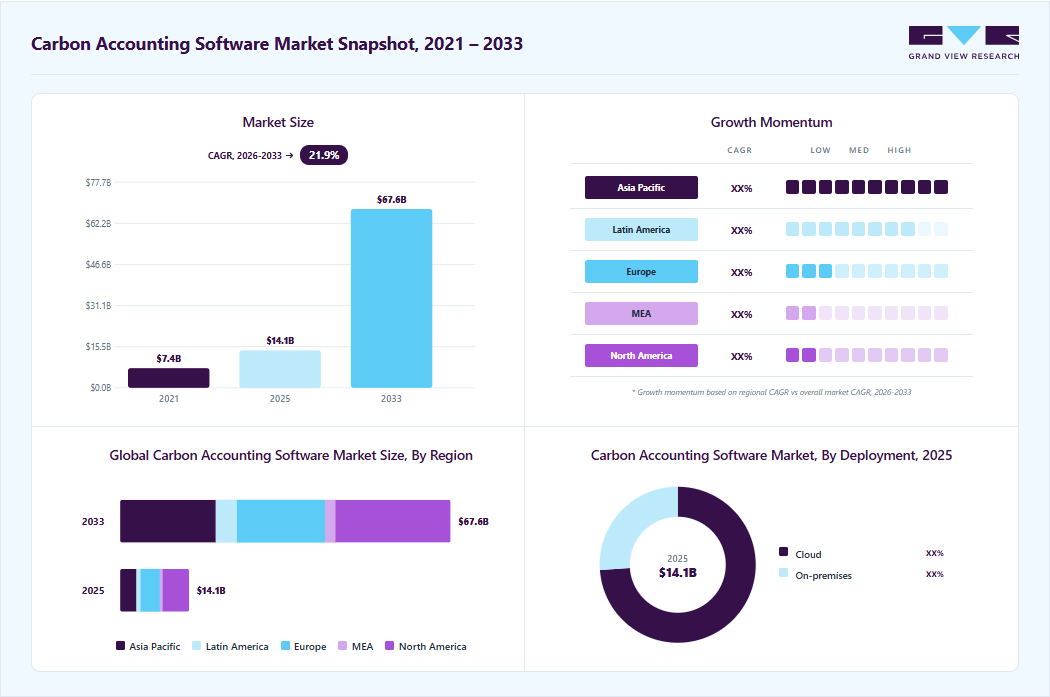
North America led the market in 2025 with a 39.0% revenue share, supported by stronger ESG reporting adoption and enterprise sustainability investments.
3. What Problem It Solves
Excel works for a small annual inventory at one site. It breaks down when you add hundreds of suppliers, multiple countries, changing emissions factor databases, and concurrent reporting frameworks.
According to CDP and BCG, Scope 3 supply chain emissions are on average 26 times greater than Scope 1 and 2 combined, yet only 15% of disclosing companies have set a Scope 3 target. At the same time, manual workflows cannot manage that data volume accurately or consistently.
Carbon tracking software is not a sustainability side tool. Instead, it is a controlled data platform that connects emissions collection, compliance reporting, forecasting, and reduction planning into one governed system. The enterprises that build it properly are the ones whose disclosure output auditors and investors actually trust.
Why Carbon Tracking Software Matters For Enterprises
Carbon tracking software matters because enterprises cannot manage emissions they cannot measure, verify, and explain to auditors. The platform gives teams a repeatable way to calculate footprints, defend methodologies, and track reduction progress easily.
Consequently, organizations can respond to customers, regulators, and investors without rebuilding broken spreadsheet processes every single reporting cycle.
1. It Turns Carbon Data Into Business Evidence
Emissions numbers increasingly affect customer contracts, investor confidence, procurement eligibility, and board reporting. This data shifting is especially important when large customers request supplier emissions details for their own Scope 3 reporting.
- Contract Retention: Large buyers now reject vendors that cannot provide accurate carbon footprint data.
- Capital Access: Institutional lenders favor firms with clear greenhouse gas emissions data management.
- Brand Protection: Publicly sharing verified metrics prevents greenwashing accusations from regulators.
Therefore, tracking becomes a core commercial requirement rather than a basic compliance task. This shift allows businesses to secure long-term contracts and maintain strong relationships with global partners.
2. It Helps Teams Move From Reporting To Reduction
Many companies collect carbon data only for annual compliance reporting. However, a stronger platform helps teams actively identify where emissions come from and what specific actions can reduce them.
- Energy Reduction: Real-time energy management system integration highlights immediate power waste.
- Procurement Shifts: Teams can execute lower-carbon procurement by evaluating supplier metrics.
- Logistics Routing: Logistics managers use route optimization to lower transport fuel burn.
- Fintech Strategy: Banks deploy a financed-emissions portfolio strategy using PCAF standard carbon accounting fintech.
- Healthcare Efficiency: Hospital networks utilize clinical supply optimization to cut waste.
As a result, businesses stop looking backward and start actively engineering their decarbonization roadmap software. This clear visibility turns environmental goals into actionable operational targets.
3. It Creates One Shared Carbon Data Source
Without a dedicated platform, sustainability teams depend entirely on slow, manual requests across disconnected departments. A platform creates a shared source of truth where each team easily owns the data it understands best.
- Automated Data Pipelines: ERP carbon data integration removes the need for manual data gathering.
- Utility Syncing: Smart meter energy consumption monitoring feeds building data directly into the system.
- Supply Chain Tracking: Vendors submit raw metrics directly through a secure supply chain carbon tracking portal.
Consequently, specialized staff can focus on carbon intensity KPI tracking instead of chasing loose files. Centralizing this data removes internal friction and speeds up the entire reporting timeline.
4. It Protects Against Future Reporting Complexity
Reporting frameworks change constantly, but your core carbon data lineage remains valuable over the long term. The strongest enterprise platforms preserve calculation methods, factor versions, source files, and approval history securely.
- Audit Readiness: A permanent carbon reporting audit trail tracks every single calculation edit.
- Framework Adaptability: The system formats data for TCFD carbon reporting automation or GRI emissions reporting frameworks.
- Regulatory Compliance: Built-in tools quickly adapt to shifting SEC climate disclosure compliance software updates.
Thus, your initial development investment remains protected against shifting political climates. Building a flexible data framework ensures that future policy updates do not break your current tracking setup.
The true value of this infrastructure is not just basic compliance. Instead, the real value centers on speed, data confidence, and operational control. Once these organizational benefits are clear, evaluating the actual carbon tracking software development cost becomes much easier to understand.
![]()
Carbon Tracking Software Development Cost: $70K–$300K
The carbon tracking software development cost usually ranges from $70,000 to $300,000 for a custom enterprise platform. A $70,000–$110,000 MVP supports limited Scope 1 and Scope 2 workflows.
A $120,000–$190,000 build adds integrations and Scope 3 modules. A $200,000–$300,000 build supports AI, audit trails, PCAF, and multi-framework reporting.
1. Cost Breakdown By Build Tier
The total budget for your project depends heavily on the scale of your operations and the complexity of your data inputs. Choosing the right tier ensures you do not overpay for unused capabilities during your initial rollout.
| Build Tier | Cost Range | Best For | What It Includes |
| Carbon Tracking MVP | $70,000–$110,000 | One business unit, one region, or pilot | Scope 1, Scope 2, data uploads, dashboards, basic reports |
| Integrated Carbon Platform | $120,000–$190,000 | Multi-site enterprises | ERP, utility, procurement, supplier intake, Scope 3 workflows |
| AI-Powered Enterprise Platform | $200,000–$300,000 | Hospitals, banks, asset managers, large enterprises | AI forecasting, anomaly detection, audit trails, PCAF, CSRD, IFRS S2 readiness |
Consequently, starting with a clear tier helps align your financial budget with immediate reporting pressures. Teams can then scale the software as regulatory demands expand over time.
2. Development Phase Cost Breakdown
Developing this software requires structured engineering phases to ensure data accuracy and compliance. This phase breakdown shows where your investment goes across the software development life cycle.
| Development Phase | Cost Range | What It Covers |
| Discovery & Carbon Methodology Scoping | $8,000–$18,000 | Scope boundaries, reporting needs, data inventory, compliance mapping |
| UX & Workflow Design | $7,000–$18,000 | Dashboards, user roles, reporting views, approval flows |
| Data Ingestion & Normalization | $18,000–$45,000 | ERP, utilities, procurement, supplier files, smart meters |
| Carbon Calculation Engine | $18,000–$42,000 | CO₂e formulas, emissions factors, Scope mapping, unit conversion |
| Reporting & Audit Trail Layer | $12,000–$32,000 | CDP, CSRD, IFRS S2, GRI, TCFD, evidence history |
| AI Forecasting & Anomaly Detection | $15,000–$45,000 | Forecasting, missing data checks, outlier detection, MLOps monitoring |
| Security, QA, DevOps, & Deployment | $12,000–$35,000 | RBAC, encryption, testing, CI/CD, production rollout |
Therefore, allocating funds across these distinct engineering blocks guarantees a structurally sound and audit-ready platform. Skipping discovery or robust QA often results in expensive re-engineering later.
3. Ongoing Maintenance Cost
Annual maintenance should be budgeted at 18–25% of the initial build cost to ensure long-term platform stability. This ongoing funding keeps your system accurate as external standards evolve.
- Infrastructure & APIs: This budget covers cloud infrastructure costs for carbon platform hosting and third-party data connections.
- Data & Framework Updates: It funds regular emissions factor database integration updates and changing framework templates.
- Security & Models: Teams use these funds for security patches, QA regression testing, and AI carbon emissions forecasting model adjustments.
- Pipeline Management: It ensures prompt carbon data pipeline architecture fixes and unexpected report layout changes.
For a deeper breakdown of ongoing cloud management, see our guide on Cost to Implement a HIPAA-Compliant Enterprise AI Platform. Additionally, consistent maintenance prevents data drift and keeps your calculations legally defensible year after year.
What Drives Carbon Tracking Software Development Cost?
The carbon tracking software development cost increases when the platform must process more data sources, support Scope 3, and connect enterprise systems. Furthermore, managing emissions factor databases, producing audit-ready reports, and running AI models add significant engineering hours. The data quality, calculation logic, integrations, and assurance controls drive most of the budget.
To help your leadership team visualize where engineering complexity impacts your budget, the following table maps major architectural decisions directly to their relative cost influence.
1. Cost Driver Table
| Cost Driver | Budget Impact | Low-Cost Setup | High-Cost Setup |
| Data Ingestion | Low to High | Manual file uploads (CSV/XLSX) | Automated ERP carbon data integration and real-time smart meters |
| Emissions Footprint Scope | Moderate to High | Scope 1 and Scope 2 only | Full Scope 3 upstream and downstream emissions tracking |
| Compliance & Reporting | Moderate | Basic GHG Protocol software implementation | Multi-framework support (CSRD, TCFD, SEC climate disclosure compliance software) |
| Intelligence Layer | High | Static carbon intensity KPI tracking | AI carbon emissions forecasting and carbon footprint anomaly detection |
Understanding these variables allows your engineering team to prioritize essential compliance features before adding complex automation layers. Consequently, you can keep your initial carbon emissions tracking platform development budget predictable.
2. Number Of Data Sources
Every new data source adds structural mapping, ingestion validation, API authentication, testing, and monitoring work. As a result, connecting to multiple disconnected enterprise systems directly inflates the overall integration hours.
- Core Enterprise Systems: Connecting to your main ERP, procurement modules, and corporate finance systems.
- Operational Inputs: Pulling direct metrics from utility providers, vehicle fleets, corporate travel portals, and cloud infrastructure.
- Facility & Supply Chain: Aggregating data from building management systems, IoT sensor carbon data integration, and raw supplier spreadsheets.
Managing this variety requires a highly scalable carbon platform architecture. For a deep look at data ingestion pipelines and system connections, see our guide on The Cost to Build a Custom Enterprise Data Ingestion Engine. Therefore, the more systems you decide to automate, the higher your data aggregation costs will be.
3. Scope 3 Complexity
Scope 3 increases development costs because it depends heavily on external supplier data, mixed spend metrics, complex logistics data, and technical estimation methods. Because this data exists outside your corporate firewalls, gathering it requires building specialized ingestion pipelines.
- Upstream Footprint: Tracking purchased goods, capital assets, fuel activities, and upstream transportation.
- Downstream Footprint: Measuring sold product processing, product use phases, end-of-life disposal, and corporate investments.
- Data Ingestion Portal: Building a secure supplier carbon tracking portal with role-based access and carbon platform security.
Consequently, engineering a reliable carbon footprint calculation engine for Scope 3 requires advanced data normalization and aggregation algorithms. This deeper level of tracking ensures your supply chain data remains defensible during public disclosures.
4. Emissions Factor Database Requirements
Emissions factor databases include public, licensed, sector-specific, and geography-specific datasets that convert operational metrics into carbon equivalents. Properly mapping these factors requires careful data architecture planning to prevent calculation errors.
- Database Connection: Building the foundational infrastructure to sync external emissions factor database integration endpoints smoothly.
- Version Management: Tracking historical factor changes over time so past calculations can be audited accurately.
- Regional Logic: Automatically mapping specific geographic emission factors to corresponding business facilities worldwide.
A hidden build decision is whether the platform will only connect to an external database, or manage factor versions internally. Managing this internally increases the custom carbon tracking platform development cost but ensures better audit trail security.
5. Reporting Framework Coverage
Development costs rise when the software must output data across many different global sustainability frameworks simultaneously. Every framework uses unique data aggregation rules, specific disclosure templates, and distinct boundary definitions.
- Foundational Frameworks: Standardizing your engine for basic GHG Protocol software implementation and CDP disclosure software requirements.
- Regulatory Compliance: Formatting calculations for TCFD carbon reporting automation and SEC climate disclosure compliance software.
- Advanced Global Standards: Structuring automated reports for GRI emissions reporting frameworks, CSRD, and IFRS S2 readiness.
Building a multi-tenant carbon SaaS architecture that easily handles these shifting templates protects your system from obsolescence. Thus, selecting only the frameworks required for your immediate operating regions keeps initial development streamlined.
6. AI and MLOps Requirements
Adding AI increases the total software investment because it introduces advanced data science, predictive model training, and continuous validation pipelines. However, these systems are critical for moving from basic compliance to predictive reduction.
- Predictive Insights: Deploying AI carbon emissions forecasting and continuous carbon footprint anomaly detection models.
- Data Quality Checks: Running machine learning algorithms to automatically spot missing data and flag extreme data outliers.
- Model Management: Setting up robust MLOps for carbon prediction models to monitor model accuracy and handle human review loops.
Using AI as operational infrastructure helps large enterprises forecast their decarbonization roadmaps under varying business scenarios. As a result, incorporating these advanced components changes your software from a basic ledger into a forward-looking strategy tool.
Architecture Of An Enterprise Carbon Tracking Platform
An enterprise carbon tracking platform needs six core layers: data ingestion, data normalization, carbon calculation, reporting, AI intelligence, and governance. Each layer controls a different part of emissions accuracy.
Weak architecture creates inaccurate reports, duplicate supplier records, poor audit trails, and slow restatements.
![]()
Layer 1 — Carbon Data Ingestion
The ingestion layer serves as the entry point for all raw operational activity metrics. To eliminate manual upload errors, engineers must build pipeline connectors that pull from a variety of distributed corporate formats.
- Corporate Infrastructure: Collecting ERP data, procurement data, corporate financial records, and cloud usage metrics.
- Operational Facilities: Syncing digital utility bills, smart meters, waste data, and building facility systems.
- Logistics & Travel: Aggregating fleet fuel logs, business travel portals, and diverse supplier files.
The engineering cost range for this ingestion layer runs from $18,000 to $45,000. For a true, live breakdown of building high-throughput, multi-source ingestion layers, see our guide on How Much To Build A Real-Time Healthcare Analytics Platform? where we map out event-driven ingestion layer engineering costs and pipeline pipelines line-by-line.
Layer 2 — Carbon Data Normalization
Raw data arrives in chaotic formats, fragmented units, and varying currencies that cannot be immediately calculated. Consequently, the normalization layer acts as a data staging environment that formats and structures these inputs uniformly.
- Standardization: Processing technical unit conversion, regional mapping, and currency normalization automatically.
- Organizational Alignment: Structuring supplier matching, facility mapping, entity mapping, and raw GL code mapping.
- Contextual Tagging: Executing category classification to line up with formal greenhouse gas emissions data management standards.
Without this layer, your calculation engine will fail due to duplicate vendor entries or conflicting metric weights. Hence, data normalization ensures clean inputs for automated auditing.
Layer 3 — Carbon Calculation Engine
The calculation engine serves as the core mathematical brain of the tracking software. It maps your normalized activity inputs directly against designated emission factor databases to output precise carbon equivalents.
- Methodology Matching: Executing activity-based calculations, spend-based calculations, and supplier-specific calculations.
- Scope Realities: Computing location-based Scope 2, market-based Scope 2, and complex CO₂e conversions.
- Auditing Logic: Managing continuous emissions factor versioning so historical calculations remain completely unchanged when factor databases update.
The engineering cost range for this calculation engine runs from $18,000 to $42,000. As a result, building a flexible calculation framework allows you to defend your math to third-party auditors.
Layer 4 — Reporting And Disclosure Layer
The reporting layer translates raw carbon calculations into high-level business insights and ready-to-export regulatory documents. This layer helps compliance officers satisfy multiple stakeholders without manual data reassembly.
- Executive Visuals: Displaying crisp dashboard views, carbon intensity KPIs, and corporate board reporting charts.
- Target Management: Tracking long-term SBTi target progress and decarbonization roadmap software milestones.
- Regulatory Formats: Generating structured CDP exports, CSRD-ready evidence packs, and IFRS S2-ready views.
Therefore, formatting data into scannable outputs saves your internal compliance teams hundreds of manual reporting hours.
Layer 5 — AI Intelligence Layer
The AI intelligence layer moves your software platform from a basic historical tracking ledger into a forward-looking optimization tool. This layer introduces advanced data science models that help fill operational data gaps.
- Predictive Insights: Running AI carbon emissions forecasting and continuous carbon footprint anomaly detection.
- Smart Estimation: Automating missing data estimation for silent suppliers and generating automated supplier risk scoring.
- Strategic Simulation: Building decarbonization scenario modeling backed by secure MLOps for carbon prediction models.
Using AI as stable enterprise infrastructure helps sustainability teams test the financial and carbon impacts of operational shifts before deploying capital.
Layer 6 — Governance And Audit Trail Layer
The governance layer establishes strict data protection, structural security, and regulatory compliance protocols across the entire ecosystem. It ensures that every single figure in your system has an immutable record of origin.
- Access Control: Enforcing rigid role-based access control platform rules to protect sensitive financial and operational metrics.
- Data Lineage: Maintaining a deep calculation history, strict approval workflows, clear evidence logs, and precise report versioning.
- Human-in-the-Loop: Integrating manual human review touchpoints alongside automated security controls.
Thus, a secure governance layer keeps your carbon data completely bulletproof during financial and environmental audits.
This architecture explains why carbon tracking software is closer to enterprise data infrastructure than generic ESG content management tools. The next section will break down exactly which features belong in each cost tier so you can build a precise deployment plan.
![]()
Features That Shape Carbon Footprint Software Development Pricing
The carbon footprint software development pricing depends heavily on whether the platform only records emissions or actively supports deep management. A basic system tracks raw emissions totals across direct operations.
However, a stronger enterprise platform supports Scope 3 supplier workflows, carbon intensity KPIs, offsets, renewable energy certificates, decarbonization roadmaps, lifecycle assessment integration, and AI-powered forecasting.
To help your leadership team map out development phases, the following table breaks down feature availability across three explicit investment tiers.
1. Operational Capability Cost Table
| Operational Capabilities | MVP Tier ($70K–$110K) | Mid-Level Tier ($120K–$190K) | Enterprise Tier ($200K–$300K) |
| Operational Boundary | Scope 1 & Scope 2 Only | Scope 1, 2, & Core Scope 3 | Full Scope 1, 2, 3 + Financed/Clinical |
| Data Intake Style | Manual Files (CSV/Excel) | Automated ERP & Utility APIs | Real-Time IoT & Multi-Tenant Pipelines |
| Audit Readiness | Basic Static Ledger Logs | Automated Change Records | Permanent Cryptographic Lineage |
| Intelligence Layer | Static Conversion Logic | KPI Threshold Alerting | Predictive AI Models & MLOps |
2. MVP Features For $70K–$110K
An initial minimum viable product focuses exclusively on establishing structural calculation trust for immediate direct footprint metrics. Consequently, this tier replaces manual office spreadsheets with a unified, cloud-hosted record book.
- Boundary Setup: Creating the foundational corporate company profile and physical facility setup definitions.
- Core Footprint Tracking: Managing direct Scope 1 tracking and indirect purchased power Scope 2 tracking.
- Calculation Mechanics: Building the manual data upload portal, automated emissions factor matching, and precise CO₂e calculation formulas.
- Basic Governance: Providing a clean executive dashboard, generic report export files, basic user roles, and static audit logs.
Therefore, this tier serves as a low-friction starting point for regional businesses or single business units. It proves that your core calculation math functions correctly before you invest in complex database automation.
3. Mid-Level Features For $120K–$190K
Mid-level software shifts your operational focus from manual tracking to automated data aggregation across complex corporate supply chains. As a result, your sustainability staff spends vastly less time hunting for loose vendor files.
- Automated Data Ingestion: Deploying live ERP carbon data integration, direct utility data integration, and procurement platform connectors.
- Supply Chain Ingestion: Building a dedicated Scope 3 supplier upload portal alongside multi-site carbon data aggregation pipelines.
- Compliance Frameworks: Formatting automated exports for CDP disclosure software and the GRI emissions reporting framework.
- Environmental Assets: Tracking environmental assets via renewable energy certificate tracking and carbon credit and offset management modules.
For a deeper analysis of how automated data ingestion engines connect with distributed corporate software networks, see our guide on How Much To Build A Real-Time Healthcare Analytics Platform?. Hence, this tier allows multi-site enterprises to maintain an audit-ready carbon reporting audit trail automatically.
4. Enterprise Features For $200K–$300K
Enterprise carbon management software introduces advanced data science layers, predictive intelligence, and specialized vertical industry configurations.
Consequently, it is designed for global corporations operating in tightly regulated sectors like banking and hospital systems.
- Predictive Operations: Running continuous AI carbon emissions forecasting, automated carbon footprint anomaly detection, and secure MLOps pipelines.
- Vertical Specialization: Integrating the PCAF standard carbon accounting fintech model for banks or healthcare Scope 3 emissions tracking for clinical networks.
- Infrastructure Scale: Engineering a multi-tenant carbon SaaS architecture, a white-label carbon reporting platform, and a deep carbon platform scalability architecture.
- Product Insights: Connecting a dedicated lifecycle assessment software integration to measure cradle-to-grave manufacturing footprints.
Deploying these automated systems allows your compliance team to defend calculations during intense regulatory reviews. Thus, this platform level becomes an essential component of modern enterprise corporate infrastructure.
5. Features To Delay Until Phase Two
Many product owners inflate their initial custom carbon tracking platform development cost by trying to build every market feature at once. However, delaying complex non-core additions protects your initial software development budget.
- Trading Marketplaces: Building custom internal carbon credit marketplaces or real-time trading desk connections.
- Web3 Integrations: Developing complex blockchain-backed offset tracking ledgers or decentralized token rewards.
- Gamified Features: Engineering employee gamification widgets, competitive sustainability leaderboards, or personal reward systems.
- Advanced Automation: Launching fully automated supplier risk scoring engines or advanced lifecycle assessments for thousands of custom products.
Because these features increase upfront engineering hours before your core calculation engine proves its accuracy, delaying them minimizes risk. Instead, focus your initial engineering budget on establishing absolute data integrity.
The initial software iteration should focus entirely on establishing absolute calculation trust, not chasing every available sustainability feature. Once your enterprise platform can successfully calculate and defend emissions to external auditors, advanced optimization workflows become much safer to add.
Compliance And Reporting Requirements The Platform Must Support
A carbon tracking platform must support recognized reporting requirements because emissions data has to be completely explainable during financial and environmental audits. The GHG Protocol software implementation provides the core mathematical and structural accounting foundation.
Furthermore, specialized frameworks like CDP, TCFD, GRI, CSRD, ESRS, IFRS S2, SBTi, and PCAF add deep disclosure templates, target tracking boundaries, assurance logic, and sector-specific reporting expectations.
To help your compliance officers map these regulatory rules directly to the system’s underlying data requirements, the following table outlines the core functionality each framework demands.
1. Compliance Framework Table
| Compliance Framework | Primary Reporting Focus | Required Structural Data Assets | Engineering Dependency |
| GHG Protocol | Foundation Carbon Accounting | Scope 1, Scope 2, Scope 3 operational boundary data | Core calculation engine rules |
| IFRS S2 & TCFD | Financial Climate Risk Disclosure | Materiality, governance inputs, gross corporate emissions | Role-based evidence layers |
| CSRD & ESRS | European Double Materiality | Climate transition planning logs, explicit energy metrics | Multi-tenant template engine |
| SBTi Target Tracker | Long-Term Reduction Pathways | Base year targets, reduction variance, pathway models | AI forecasting models |
| PCAF Standard | Financed Financial Emissions | Portfolio asset attribution, explicit asset class data | Specialized fintech logic |
Understanding these requirements prevents your team from building an isolated data model that fails to satisfy international regulatory standards. Consequently, building these frameworks into your core architecture protects your upfront software investment.
2. GHG Protocol Software Implementation
The GHG Protocol software implementation establishes the strict operational boundaries, organizational definitions, and baseline math formulas that run your entire application.
Because it serves as the universal standard for corporate carbon bookkeeping, your engineering architecture must align with its rules.
- Boundary Management: Defining explicit organizational boundaries and distinct operational boundaries across all global corporate offices.
- Categorization: Structuring independent calculation pipelines for direct Scope 1, indirect utility Scope 2, and supply chain Scope 3 emissions.
- Methodology Tracking: Storing comprehensive calculation methodology logs alongside deep emissions factor documentation to maintain complete reporting consistency over time.
Therefore, setting up this foundational standard ensures your software speaks the same language as international validation bodies. It provides the absolute mathematical framework upon which all advanced analytics are subsequently layered.
3. IFRS S2 And Climate Disclosure Readiness
The IFRS S2 standard focuses on how climate-related risks and opportunities impact an enterprise’s short-term financial stability and long-term market valuation. Consequently, the platform must connect carbon footprints directly to corporate risk management strategies.
- Financial Risk Mapping: Documenting quantitative climate risk reporting metrics alongside high-level corporate governance and business strategy responses.
- Emissions Integrity: Disclosing raw, gross GHG emissions across all three distinct operational scopes without initial offset subtractions.
- Target Metrics: Capturing quantitative metrics and targets while applying strict materiality thresholds to corporate data streams.
Building these modules prepares your organization for intense financial auditor reviews. For a true, live analysis of how enterprise data structures are engineered to handle high-level governance and transactional tracking under strict regulatory scrutiny, see our real publication on How Can AI Automate Suspicious Activity Report Generation?
As a result, your system translates environmental data into clear business evidence.
4. CSRD, ESRS, CDP, TCFD, And GRI
Global enterprises operating across multiple international regions must satisfy a complex mixture of voluntary disclosures and mandatory regional reporting templates. This module acts as a dynamic translation layer that reformats your core carbon table to match varying external designs.
- Materiality Logic: Integrating explicit double materiality support to measure how corporate operations impact the environment and vice versa.
- Strategic Planning: Storing corporate climate transition plans, precise energy data profiles, and granular emissions breakdowns.
- Audit Evidence: Attaching permanent compliance evidence files, governance text fields, and chronological report history logs to every submission.
Thus, implementing a modular template system allows your compliance team to fulfill shifting international requests easily without altering the core calculation codebase.
5. SBTi Target Tracking Software
Fulfilling corporate climate promises requires moving past static annual reports and actively tracking long-term reduction paths against fixed historical baselines. This software module uses predictive algorithms to alert leadership when real-world emissions drift away from public commitments.
- Baseline Management: Defining your corporate base year metrics alongside near-term targets and long-term net zero targets.
- Variance Tracking: Calculating real-time target variance and mapping emissions reductions against an approved reduction pathway.
- Strategic Roadmaps: Integrating predictive data insights directly into your high-level decarbonization roadmap software and continuous progress monitoring dashboards.
Using these tracking metrics prevents your company from missing critical sustainability milestones. Consequently, it changes your software from a retrospective ledger into a forward-looking operational compass.
6. PCAF For Financial Services
For banking institutions, asset managers, and insurance networks, the vast majority of carbon exposure exists within their lending portfolios and investment funds rather than their physical office buildings. The PCAF standard provides the specialized formulas required to measure this complex financed exposure.
- Asset Class Allocation: Calculating specific portfolio attribution and financed emissions across listed equity, corporate bonds, and business loans.
- Project & Consumer Finance: Tracking emissions stemming from active project finance, commercial mortgages, and motor vehicle loans.
- Data Certainty: Applying explicit data quality scores to individual investment positions based on the availability of primary supplier metrics.
Integrating this financial accounting model requires deep familiarity with corporate ledger connections and transactional databases.
Thus, building a dedicated PCAF module ensures that asset managers can confidently defend their fund disclosures to financial regulators.
Regulatory compliance does not simply add superficial reporting text fields to a dashboard. Instead, it completely dictates the platform’s underlying data model, core calculation logic, evidence retention requirements, and continuous software maintenance plan.
Healthcare And Financial Services Use Cases That Change Cost
Healthcare and financial services carbon platforms cost more than generic tools because their underlying emissions data is highly sector-specific. Hospitals need complex tracking for facility power, procurement networks, clinical waste, medical gases, pharma supplies, and vendor records.
Conversely, banks and asset managers require financed emissions frameworks, portfolio mapping structures, specific asset-class logic, and deep PCAF data quality scoring matrices.
Cost Breakdown By Industry-Specific Module
To help your financial planning teams evaluate these specific vertical requirements, the following matrix outlines development budgets based on specialized industry modules.
| H3: Industry-Specific Module | Primary Operational Data Focus | Special Compliance Standard | System Cost Range |
| Hospital Carbon Footprint Software | Medical gas, clinical waste, HVAC, facility power | GHG Protocol, local hospital regulations | $140,000–$260,000 |
| Healthcare Scope 3 Tracking | Pharma supply chain, medical device lifecycles, travel | Supplier data, GHG Scope 3 Categories | Included in Healthcare Build |
| Asset Manager Carbon Ledger | Financed emissions, equity portfolios, loan books | PCAF Standard, IFRS S2 Climate Rules | $160,000–$300,000 |
| Insurance Climate Disclosure | Underwriting exposure, commercial real estate portfolios | TCFD, catastrophe risk calculations | Included in Financial Build |
| Pharma & Life Sciences Tracking | API suppliers, contract manufacturers, cold chain logistics | Lifecycle Assessment (LCA) Integration | $150,000–$270,000 |
Building these highly tailored data architectures prevents your system from outputting vague averages that fail strict regulatory scrutiny. Consequently, targeting sector-specific data streams remains the most reliable method to ensure long-term accounting accuracy.
AI-Powered Carbon Tracking Software Cost
An AI-powered carbon tracking software cost usually adds $15,000 to $45,000 to the foundational platform build. These specialized modules run intelligence algorithms across your normalized data tables. The primary enterprise use cases include predictive emissions forecasting, anomaly detection, missing data estimation, supplier risk scoring, and decarbonization scenario planning.
Crucially, AI must support human review and planning rather than silently altering official reported footprint numbers.
To help your technology leaders budget for predictive capabilities, the following matrix breaks down the development cost and engineering complexity of individual intelligence modules.
| H3: AI Intelligence Module | Core Machine Learning Focus | Upfront Engineering Cost | Operational Benefit |
| AI Emissions Forecasting | Regression models, time-series facility energy projections | $15,000–$30,000 | Predicts target variance before annual reporting deadlines |
| Carbon Anomaly Detection | Isolation forests, clustering algorithms for outlier data | $10,000–$25,000 | Identifies utility bill spikes and entry errors instantly |
| Missing Data Imputation | Predictive estimation models with confidence scoring | $12,000–$28,000 | Generates defensible fallbacks for non-reporting suppliers |
| MLOps & Drift Control | Continuous model tracking, versioning, and validation | $15,000–$35,000 | Prevents predictive model degradation over time |
Implementing these features transforms your software platform from a retrospective ledger into a forward-looking operational tool. Consequently, these models enable your team to react to emissions data drift long before public filing dates.
1. AI Carbon Emissions Forecasting
AI carbon emissions forecasting uses historical activity data to project future environmental impacts under various operational conditions. This predictive capability allows financial and operational leaders to test sustainability strategies before deploying capital.
- Asset Projections: Running facility emissions forecasting, portfolio emissions forecasting, and long-term Scope 2 trend forecasting.
- Operational Planning: Generating highly accurate energy demand predictions and forward-looking carbon intensity predictions.
- Target Accountability: Modeling long-term target variance to show exactly how new production lines affect corporate net-zero timelines.
Consequently, engineering these models allows teams to view environmental implications alongside traditional financial forecasts. This visibility turns vague sustainability aspirations into concrete engineering goals.
2. Carbon Footprint Anomaly Detection
Carbon footprint anomaly detection acts as an automated internal audit layer that constantly scans incoming data streams for compliance errors. Because human data entry is inherently imperfect, this module flags statistical outliers before they reach auditors.
- Invoicing Checks: Catching abnormal utility spikes, missing data months, and impossible unit conversions.
- Vendor Validation: Highlighting duplicate supplier uploads and extreme outlier supplier records.
- Scope Integrity: Spotting sudden Scope 3 category jumps that indicate structural pipeline classification mistakes.
Therefore, deploying automated anomaly checks protects your core system from calculating incorrect carbon footprint metrics.
3. Missing Data Estimation With Confidence Scores
Gathering primary data across hundreds of third-party vendors often results in missing or incomplete data fields. This estimation module solves that issue by calculating scientifically defensible fallbacks based on recognized international averages.
- Estimation Logic: Executing spend-based fallback calculations, supplier-average estimation modeling, and localized activity-data approximations.
- Transparency Layer: Assigning explicit confidence labels and automated methodology notes to every estimated figure.
- Human Oversight: Routing all calculated estimates into a dedicated reviewer approval dashboard for formal sign-off.
The core engineering principle requires that all AI-generated estimates remain clearly labeled within the system. Consequently, auditors can easily separate primary corporate inputs from calculated secondary estimations.
4. MLOps For Carbon Prediction Models
Machine learning models require continuous monitoring, regular retraining, and structured code versioning to maintain their predictive accuracy. Without a stable MLOps pipeline, your algorithms will suffer from data drift as corporate operations evolve.
- Model Management: Setting up a secure model registry, model versioning lines, and continuous model validation scripts.
- Pipeline Monitoring: Tracking predictive drift metrics, automated retraining routines, and quick model rollback switches.
- Audit Compliance: Logging all model adjustments inside centralized reviewer dashboards and permanent software audit logs.
Thus, investing in MLOps guarantees that your predictive tracking features remain compliant over multi-year reporting cycles. It ensures your software functions as reliable corporate infrastructure rather than an unstable prototype.
5. What AI Should Not Do
While machine learning speeds up administrative processing, it must never operate completely autonomously within an enterprise compliance application. Setting up strict guardrails prevents the system from making unverified accounting adjustments.
- No Automated Inventions: The system must never invent missing supplier emissions without a verified calculation framework.
- No Direct Rewrites: Algorithms must never overwrite verified historical data or hide underlying calculation assumptions.
- No Auto-Submissions: Software must never submit final disclosures automatically or replace human sustainability reviews.
Removing autonomous decision-making ensures that your organization retains total ownership over its published data. As a result, every single figure remains completely defensible during regulatory examinations.
AI can make carbon compliance teams vastly faster and more proactive during intense reporting cycles. However, the technology must stay entirely inside a governed workflow where every estimate, forecast, and recommendation can be reviewed by human administrators.
Build Carbon Tracking Software With Intellivon
Enterprises choose Intellivon to build carbon tracking software because emissions reporting now needs more than calculators and dashboards.
Instead, it needs governed data infrastructure, reliable carbon calculation engines, enterprise integrations, AI-assisted forecasting, audit trails, and compliance-ready workflows that help leadership trust the numbers behind every Scope 1, 2, and 3 disclosure.
1. We Understand Carbon Data Readiness Before Development Starts
Carbon tracking software works only when the data foundation is clear. Intellivon helps enterprises define Scope 1, 2, and 3 boundaries, source systems, reporting goals, data quality issues, integration effort, compliance needs, and ownership cost before engineering begins.
This helps leaders avoid building dashboards on weak emissions data, incomplete supplier inputs, or unclear reporting assumptions.
2. We Build The Calculation And Integration Foundation
Carbon tracking platforms need strong integrations before they need advanced AI. Intellivon builds systems that connect ERP platforms, utility data, supplier records, procurement data, emissions factors, calculation engines, audit logs, role-based access, and reporting workflows into one governed environment.
This gives enterprises a carbon data foundation that can support internal reporting, investor disclosures, supplier reviews, and audit preparation.
For a deeper breakdown of healthcare data integration, see our guide on [LINK: Cost To Develop a Healthcare Data Interoperability Platform].
3. We Add AI Only After The Data Layer Is Trusted
AI improves carbon tracking when it supports forecasting, anomaly detection, missing data checks, confidence scoring, MLOps, explainability, and human review. Intellivon adds AI as a controlled decision-support layer, not as an unchecked reporting shortcut.
That means every forecast, data flag, and AI-assisted insight can be traced, reviewed, and explained before it affects executive reporting.
For a deeper breakdown of governed AI systems, see our guide on [LINK: Development Cost For Enterprise AI Governance Framework].
4. We Support Healthcare And Fintech Carbon Workflows
Carbon tracking requirements become more complex in regulated sectors. Intellivon supports healthcare workflows such as hospital Scope 3 emissions, HIPAA-aligned data architecture, pharma procurement emissions, supplier reporting, audit trails, and facility-level sustainability dashboards.
For fintech enterprises, Intellivon can support financed emissions, PCAF-aligned portfolio reporting, carbon risk analytics, governance workflows, and audit-ready disclosure systems.
For a deeper breakdown of regulated fintech AI architecture, see our guide on [LINK: What Does It Cost to Build an AI AML Compliance Copilot?].
5. Why Enterprises Work With Intellivon
Enterprises work with Intellivon because carbon tracking software often sits at the intersection of data engineering, AI, compliance, reporting, and enterprise integration.
Intellivon brings 500K+ engineering hours, ex-MAANG engineering experience, healthcare and fintech AI delivery, HIPAA-ready development practices, and production-first implementation.
The team also brings AI, LLM, MLOps, agentic workflow, and complex integration expertise, which helps enterprises build carbon tracking platforms that can scale beyond first-year reporting.
If your team is budgeting a carbon tracking platform, Intellivon can help define the architecture, reporting scope, integration roadmap, AI boundaries, compliance requirements, and three-year ownership cost before development begins.
![]()
Conclusion
Carbon tracking software helps enterprises move from estimated emissions reporting to governed, audit-ready carbon intelligence. By connecting operational data, emissions factors, supplier inputs, and reporting workflows, it improves accuracy, accountability, and decision-making.
Moreover, AI forecasting and anomaly detection can highlight risks earlier when the data foundation is trusted. Therefore, the right platform supports compliance, cost control, climate planning, and long-term decarbonization goals across complex enterprise operations with measurable business value.
Things To Know About Carbon Tracking Software Development Cost
Q1. How much does it cost to build carbon tracking software?
A1. Custom carbon tracking software usually costs $70,000 to $300,000. A $70,000 to $110,000 MVP covers Scope 1 and Scope 2 tracking, dashboards, basic calculations, and exports. However, a $200,000 to $300,000 enterprise build adds Scope 3, integrations, AI forecasting, audit trails, PCAF, and multi-framework reporting.
Q2. How long does custom carbon tracking platform development take?
A2. Custom carbon tracking platform development usually takes 10 to 36 weeks. A focused MVP takes 10 to 14 weeks. Meanwhile, an integrated platform with ERP, utility, supplier, and reporting workflows takes 16 to 24 weeks. However, AI-powered enterprise builds with Scope 3, PCAF, MLOps, and audit trails take 24 to 36 weeks.
Q3. Is Excel enough for Scope 1 and Scope 2 carbon reporting?
A3. Excel is enough only for small annual Scope 1 and Scope 2 reporting with limited invoices, fuel records, and utility bills. However, it becomes risky when teams need many sites, frequent reporting, Scope 3 supplier data, emissions factor versioning, approval logs, and repeatable audit evidence.
Q4. What makes Scope 3 carbon tracking so difficult?
A4. Scope 3 carbon tracking is difficult because most data sits outside the company’s direct control. Suppliers may submit late, incomplete, or inconsistent records. Therefore, the platform must support supplier uploads, spend-based fallback methods, activity-based data, data quality scoring, and clear assumptions for every Scope 3 category.
Q5. What integrations does carbon emissions tracking software need?
A5. Carbon emissions tracking software usually needs ERP, procurement, utility, smart meter, fleet, travel, supplier, finance, and data warehouse integrations. Additionally, healthcare platforms may need facility, waste, pharma, medical device, and anesthetic gas data. Financial platforms may need portfolio, loan, investment, and PCAF data sources.
Q6. How much does AI-powered carbon tracking software cost?
A6. AI-powered carbon tracking software usually adds $15,000 to $45,000 to the first build. This covers forecasting, anomaly detection, missing data estimation, confidence scoring, model monitoring, and reviewer workflows. However, costs rise with private deployment, MLOps, explainability, regulated approval controls, and advanced enterprise governance.
Q7. Can carbon tracking software support GHG Protocol and CSRD?
A7. Yes, carbon tracking software can support GHG Protocol calculations and map outputs to CSRD, ESRS, CDP, GRI, TCFD, IFRS S2, and SBTi workflows. However, the platform must preserve data lineage, emissions factor versions, calculation methods, approvals, and report history to support assurance.
To Sum Up:
- A $70,000 carbon tracking MVP can prove Scope 1 and Scope 2 reporting value, but it should not be positioned as a full enterprise Scope 3 platform.
- Scope 3 usually costs more to operationalize than dashboards because the hardest work is supplier data validation, not visualization.
- AI should forecast, flag anomalies, and estimate missing values with confidence labels. It should not silently change reported emissions.
- Hospitals need carbon platforms that understand procurement, medical gases, waste, pharma, devices, and food supply chains.
- Financial institutions need PCAF-ready financed emissions logic, which makes their carbon platform different from generic ESG software.