Key Takeaways:
-
Production ICU lab architecture combines Epic Beaker data, FHIR R4 context, and HL7 v2 ORU feeds for event-driven results.
-
An ICU aggregation layer combines labs with vitals, medications, ventilators, pumps, and flowsheets into one clinical view.
-
LOINC and local code normalization, SMART on FHIR authentication, and role-based visualization are core architecture requirements.
-
HIPAA controls, optional AI clinical decision support, and Epic approval timelines significantly influence the overall implementation scope.
-
How Intellivon builds ICU lab data platforms costing $70,000 to $300,000 with 3- to 7-month delivery timelines.
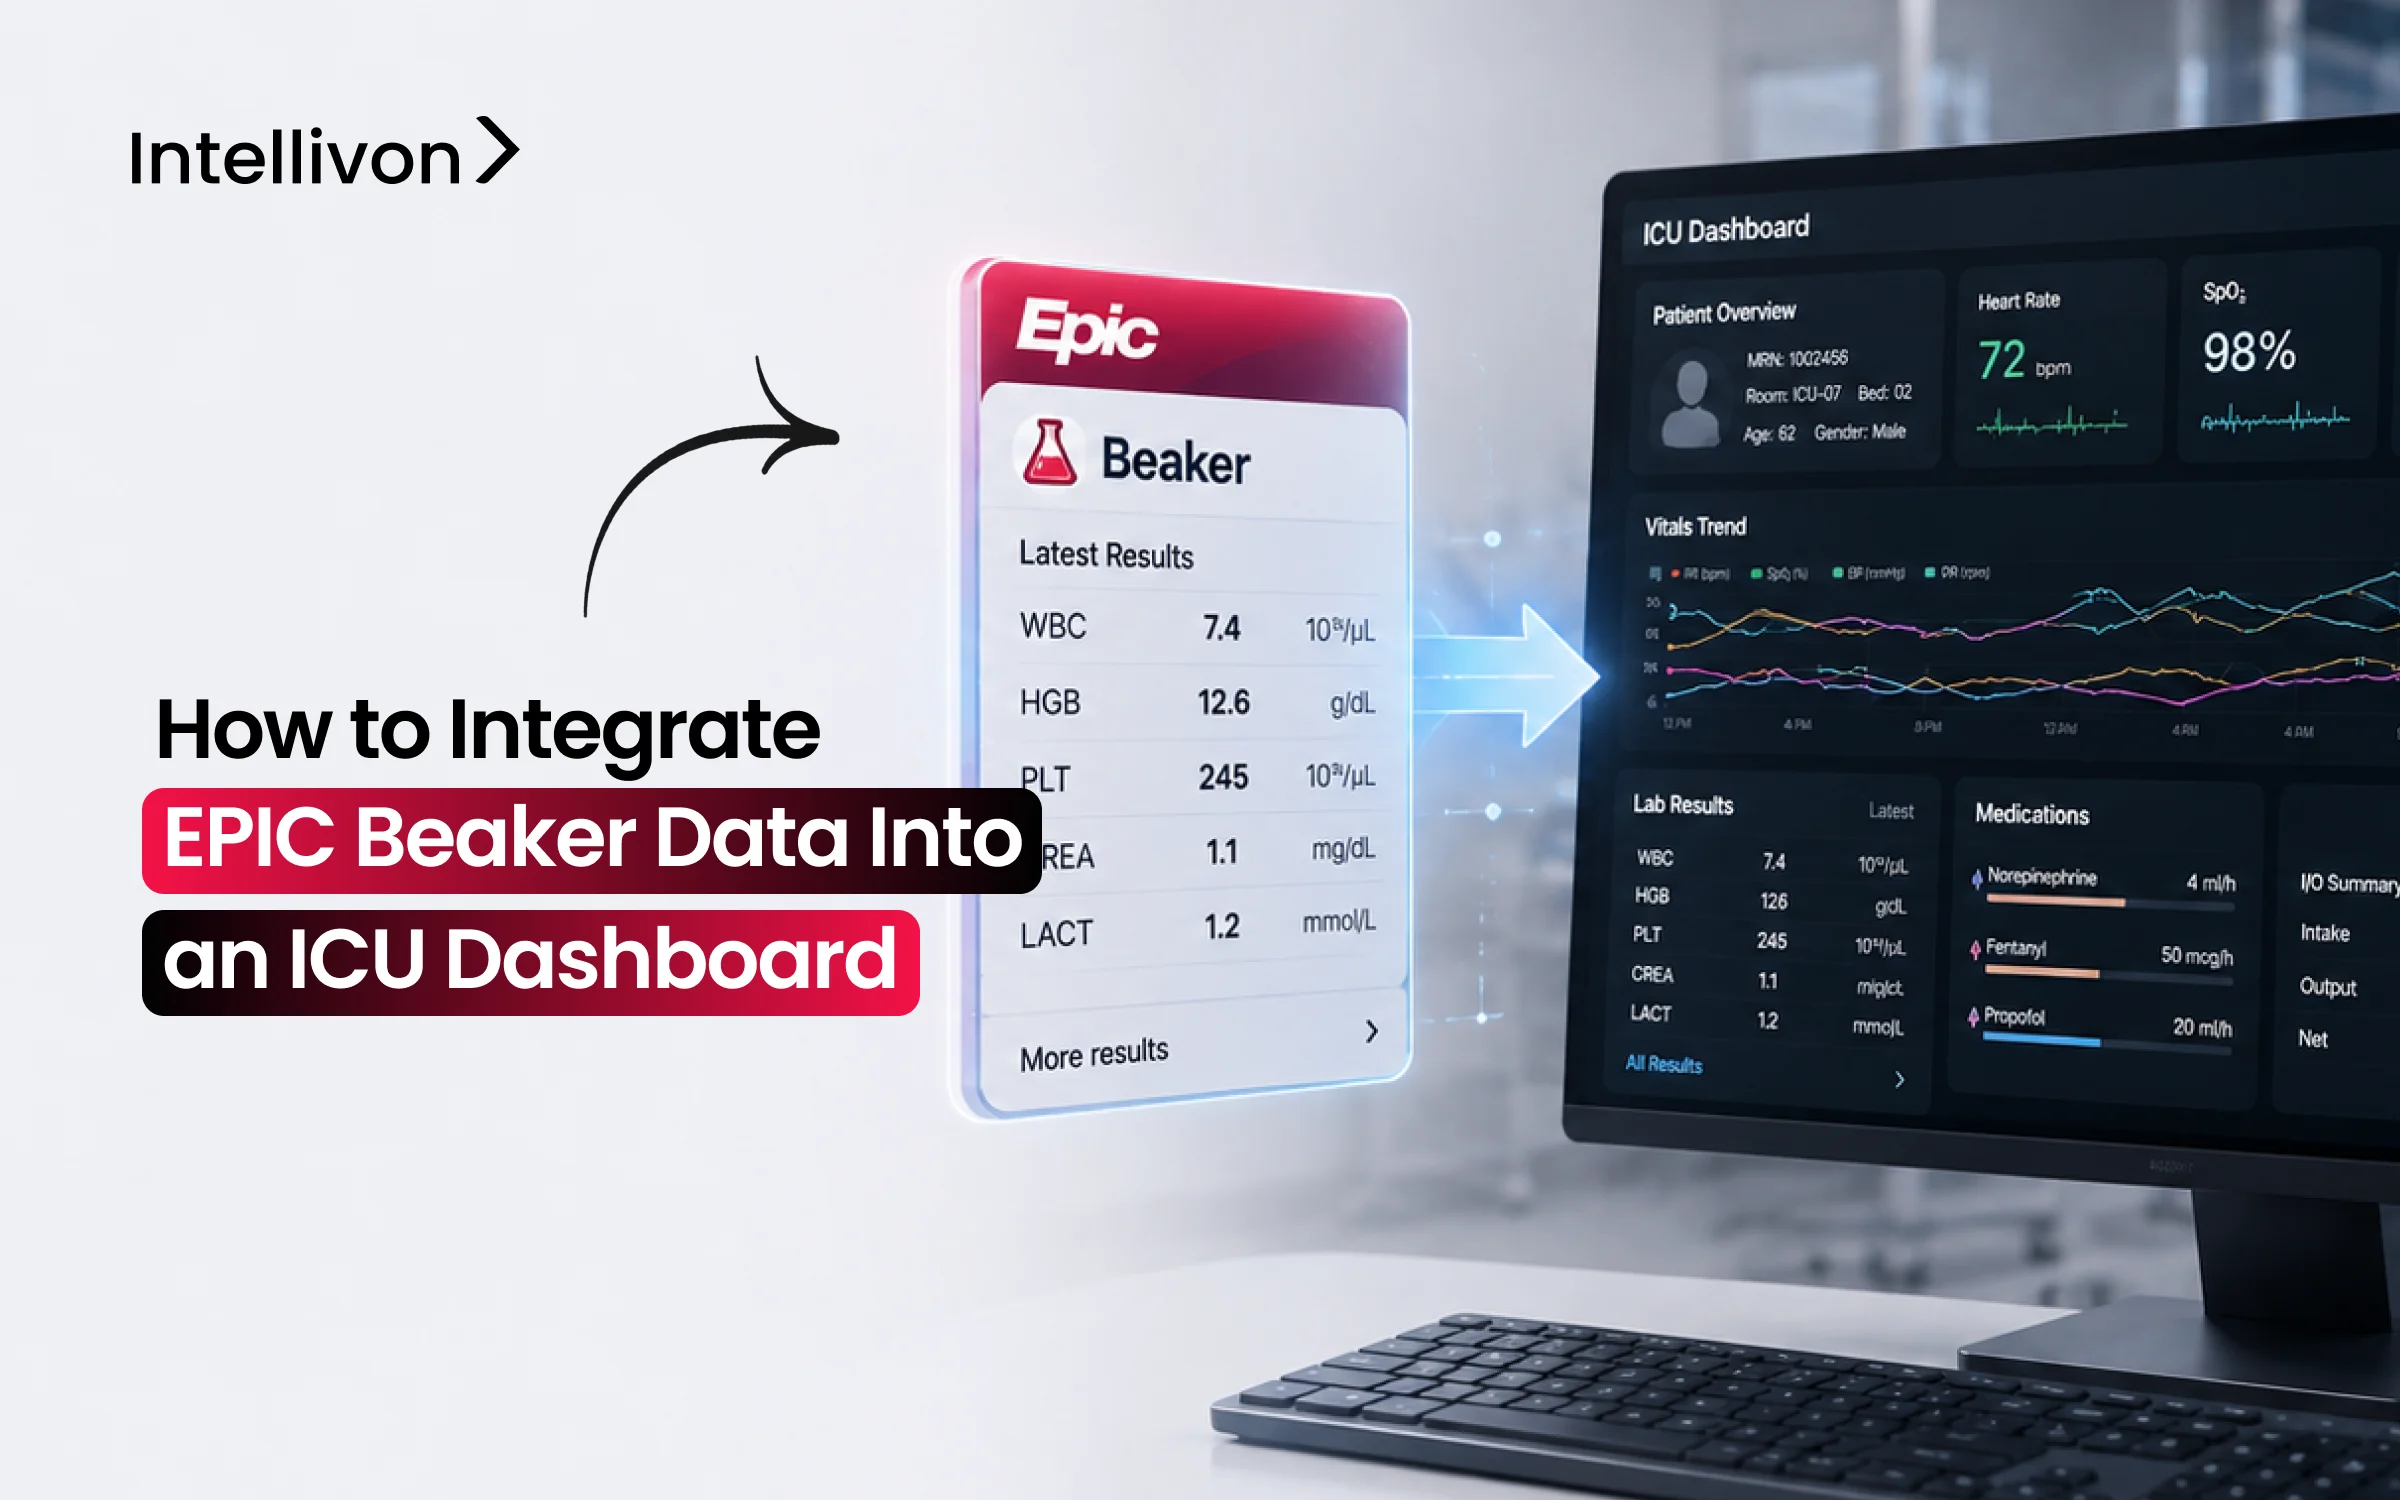
Epic Beaker data integration into an ICU dashboard means pulling lab results and trend data into the same screen as vitals and ventilator settings. Incomplete or delayed data contributes to 19% of early warning score inaccuracies. As a result, high-risk cases still get an untimely response 75% of the time, according to a 2026 scoping review on deterioration alerting. A dashboard that leaves lab data one tab away isn’t solving that problem. Instead, it’s recreating it.
The real technical decision here is polling versus event-driven alerting. Beaker doesn’t push data to external systems on its own. So a dashboard has to either poll the FHIR API on an interval or subscribe to HL7 ORU messages as results post. Polling is simpler to build, but it introduces the exact lag that delays a critical result. Meanwhile, event-driven design costs more upfront. However, it pays that cost back the first time a STAT result reaches the bedside within seconds, not minutes.
In this blog, we’ll cover real-time streaming architecture, multi-source data aggregation, alert design, and role-based views. Additionally, we’ll break down what this build costs compared to buying a pre-built dashboard module.

What Epic Beaker Data Integration Means for ICU Dashboards
Epic Beaker serves as the laboratory information layer supplying ordered tests, verified results, specimen metadata, reference ranges, and microbiology cultures. An Epic Beaker data integration ICU dashboard does not replace Beaker. Instead, it creates a governed clinical presentation and decision layer that merges laboratory timelines with telemetry and bedside flowsheets.
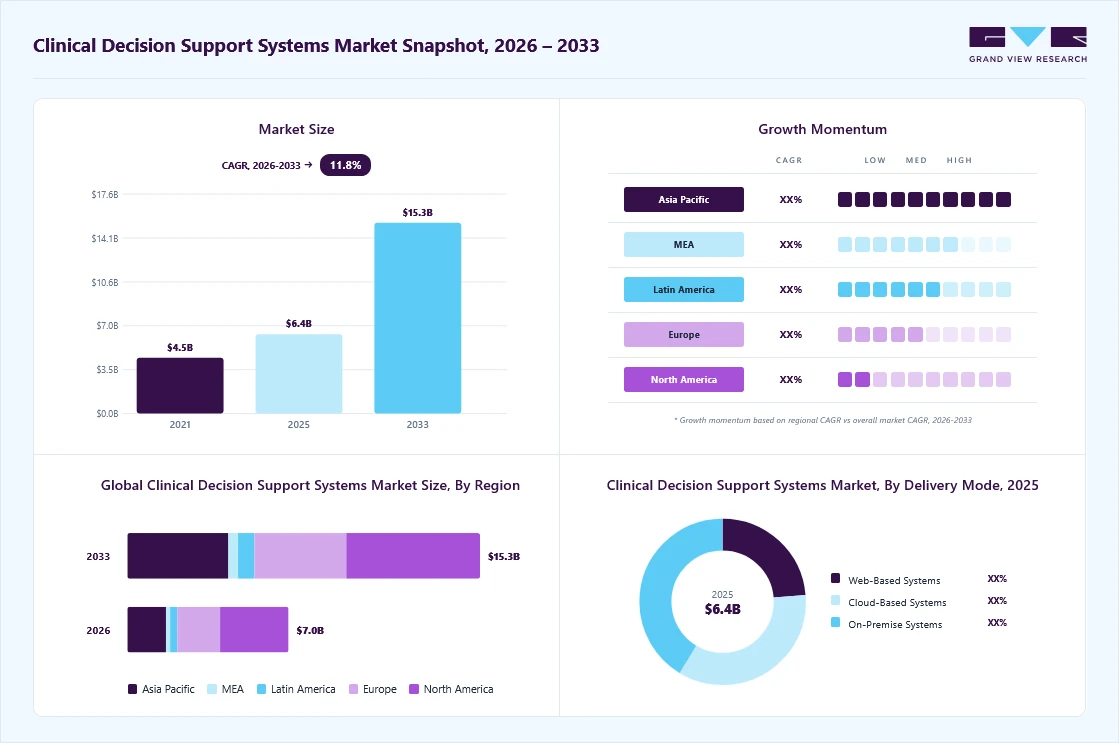
According to Grand View Research, the clinical decision support market will grow at an 11.8% CAGR through 2033. This demand reflects the shift toward integrated EHR ecosystems that process acute diagnostic data in real time. Consequently, hospital IT teams must distinguish core laboratory workflows from intensive care delivery.
- Pathology Focus (CP vs. AP): Critical care teams rely almost exclusively on Clinical Pathology (CP) data, including arterial blood gases, metabolic panels, and blood cultures. Anatomic Pathology (AP) tissue reports rarely drive acute ICU interventions.
- Operational vs. Clinical Dashboards: Native Beaker dashboards monitor specimen turnaround times and analyzer queue throughput. In contrast, custom ICU dashboards synthesize lab velocities alongside bedside ventilator and hemodynamic streams.
- Read-Only vs. CDS Applications: Read-only dashboards visualize trends to reduce cognitive load. Advanced CDS tools compute acuity scores and suggest protocol-driven order sets back to Epic.
- Census vs. Patient-Level Views: Unit-level census screens prioritize abnormal alerts across thirty beds simultaneously. Individual views isolate time-series trajectories for single-patient rounds.
- Source of Truth Provenance: Beaker must always retain legal custody and provenance for result verification. The custom presentation layer simply consumes this structured data for rapid bedside consumption.
Establishing this structural boundary prevents data duplication while surfacing actionable physiological insights.
Which Epic Beaker Data Should Flow Into the ICU Dashboard
An effective Epic Beaker data integration ICU dashboard must extract discrete, time-critical laboratory values, microbiology cultures, and provenance metadata without overloading system bandwidth.
Instead of pulling entire medical records, ICU dashboards isolate acute laboratory feeds across five functional domains to drive rapid clinical interventions.
1. Core Laboratory Results
Critical care providers need continuous visibility into chemistry, hematology, and arterial blood parameters. These markers indicate organ failure, systemic shock, and metabolic instability.
- Biochemical & Hematologic Panels: CBC with differential, CMP, BMP, and blood glucose.
- Critical Perfusion & Gas Metrics: Arterial blood gases (ABGs) and serial lactate.
- Organ Function & Cardiac Biomarkers: Creatinine, eGFR, troponin, BNP, and inflammatory markers like procalcitonin.
- Coagulation Profiles: Prothrombin time (PT), international normalized ratio (INR), and partial thromboplastin time (PTT).
2. Microbiology and Cultures
Infection timelines require tracking sample growth from preliminary notifications to verified antimicrobial profiles.
- Blood Cultures: Initial positivity alerts, Gram-stain notifications, and final specimen clearances.
- Antimicrobial Data: Organism identification, minimum inhibitory concentration (MIC), and susceptibility matrices.
- Audit Trails: Specimen collection timestamps, lab receipt dates, and result-posting times.
3. Result Interpretation Metadata
Raw numeric outputs lack utility without laboratory context, flags, and legal status flags.
- Values & Limits: Numerical values, clinical units, and institutional reference ranges.
- Urgency Signals: Native Beaker critical-value flags, abnormal high/low indicators, and delta checks.
- Status Provenance: Preliminary, final, amended, or canceled verification states.
4. Trending and Serial Information
Single laboratory values offer limited insight compared to dynamic physiological trajectories over time.
- Resuscitation Velocity: Clearance rates for serial lactate and continuous glucose tracking.
- Renal & Hematologic Shifts: Forty-eight-hour creatinine slopes, platelet counts, and hemoglobin drop velocity.
5. Patient and Encounter Context
Dashboards must map incoming laboratory streams directly to the active critical care setting.
- Location Mapping: Current encounter IDs, ICU bed assignments, and transfer statuses.
- Workflow State: Placer/filler order IDs and pending ServiceRequest status queues.
ICU Data Element and Clinical Purpose
| ICU Data Element | Clinical Purpose | Epic / FHIR Object | Refresh Priority |
| Lactate | Sepsis & tissue perfusion | Observation (Labs) | High |
| Creatinine | AKI tracking & staging | Observation (Labs) | High |
| Blood Culture | Infection & antibiotic stewardship | DiagnosticReport / Observation | High |
| CBC | Hematologic trend & blood loss | Observation (Labs) | Medium-High |
| Active Orders | Pending diagnostic workload | ServiceRequest / Order APIs | Medium |
| Patient Demographics | Bed attribution & census identity | Patient / Encounter | High |
Accurately capturing these five data streams forms the foundation for reliable clinical decision support. Next, we review the integration architecture that ingests this data from Epic Beaker into the ICU environment.
FHIR, HL7, or Epic Interfaces: Which Path Should You Use?
Choosing the right protocol depends entirely on whether your ICU application requires event-driven streaming, on-demand REST queries, or historical cohort analysis.
At the same time, high-performing critical care environments use a hybrid model rather than relying on a single interface. Consequently, HL7 v2 handles high-volume event pushes, while RESTful FHIR manages contextual on-demand queries.
1. Fast Healthcare Interoperability Resources (FHIR R4)
FHIR R4 provides modern REST endpoints for pulling granular, semantically standardized clinical resources. At the same time, it queries discrete elements like Observation for lab panels, DiagnosticReport for microbiology summaries, and Patient or Encounter for bed attribution.
However, polling FHIR endpoints repeatedly for real-time ICU alerts causes unnecessary API overhead.
2. SMART on FHIR and OAuth 2.0
SMART on FHIR embeds the dashboard directly into the Epic Hyperdrive clinician workflow without extra logins. At the same time, it uses OAuth 2.0 tokens scoped to the active patient chart to render custom visualizations within the EHR workspace.
For background services, backend OAuth 2.0 enables autonomous ingestion without requiring clinician interaction.
3. HL7 v2 and Interface Engines
HL7 v2 feeds remain the benchmark for sub-second, event-driven laboratory updates. When Beaker verifies a result, it transmits an ORU^R01 message containing OBR and OBX segments over Minimal Lower Layer Protocol (MLLP).
At the same time, an interface engine captures these feeds, manages ACK/NACK confirmations, and pushes results into the dashboard pipeline with minimal latency.
4. Epic Interconnect and Reporting Databases
Deep EHR workflows often require Epic-specific Interconnect web services for proprietary operations.
Conversely, Clarity and Caboodle relational databases serve long-term cohort reporting and retrospective quality analytics. Because these databases rely on scheduled ETL batch jobs, they are unsuitable for live critical care workflows.
FHIR vs HL7 vs Epic Interfaces
| Integration Requirement | Preferred Path | Mechanism |
| Event-Driven Result Push | HL7 v2 (ORU^R01) | MLLP with ACK/NACK validation |
| On-Demand Lab History | FHIR R4 (Observation) | RESTful API query |
| Diagnostic & Specimen Context | FHIR R4 (DiagnosticReport) | RESTful API query |
| Embedded EHR Launch | SMART on FHIR | User-level OAuth 2.0 |
| Autonomous Data Ingestion | FHIR / Custom Backend | Backend System OAuth 2.0 |
| Longitudinal Population Analytics | Epic Clarity / Caboodle | Relational ETL batch pipeline |
| Hybrid Multi-Source Aggregation | HL7 v2 + FHIR R4 | Event stream & REST layer |
FHIR subscription and webhook capabilities vary significantly across hospital environments and Epic release versions. Therefore, teams should verify local infrastructure support before designing an event-driven architecture around FHIR.
For a deeper breakdown of multi-source enterprise architectures, see our guide on AI in Financial Risk Management: Custom Risk Tools for Enterprise.
Selecting the optimal transport layer prevents downstream bottlenecks in the ICU data pipeline. Next, we explore the step-by-step architectural blueprint required to build a production-ready dashboard.
Reference Architecture for a Real-Time ICU Clinical Dashboard
A production-grade Epic Beaker data integration ICU dashboard architecture decouples the clinical source of truth from high-frequency visualization layers. Consequently, this architectural boundary prevents intensive clinician queries from degrading electronic health record performance.
Instead of converting the dashboard into an ungoverned secondary database, the platform ingests, normalizes, analyzes, and caches acute telemetry alongside laboratory data.
Meanwhile, parallel critical care feeds, such as bedside physiologic monitors, mechanical ventilators, and infusion pumps, route through high-throughput message brokers alongside laboratory data.
Architecture Reference For ICU Clinical Dashboard
| Architectural Component | Core Technology | Primary Responsibility in ICU Pipeline |
| Ingestion Gateway | MLLP Engine / FHIR Gateway | Captures ORU^R01 pushes and manages ACK/NACK handshakes. |
| Event Bus & Queues | Apache Kafka / RabbitMQ | Buffers burst traffic with dead-letter queues and retry handling. |
| Normalization Service | Microservices Engine | Maps local hospital codes to standard LOINC and UCUM units. |
| Persistence Layer | TimescaleDB / MongoDB | Stores longitudinal time-series data separate from Epic. |
| Caching Layer | Redis / In-Memory Cluster | Delivers sub-second data fetches for 30+ bed census views. |
| CDS & Analytics | Python / ONNX Runtime | Executes real-time deterioration, sepsis, and AKI algorithms. |
| Streaming API | WebSockets / SSE (Node/Go) | Pushes delta updates to frontends without client polling. |
Additionally, strict role-based access control, mutual TLS encryption, and immutable audit logs ensure complete HIPAA alignment across all data nodes.
Furthermore, for a deeper breakdown of enterprise data pipelining, see our guide on OpenEMR Implementation for Nurses: Features, Workflow & Benefits.
Ultimately, this multi-tiered architecture protects core hospital EHR infrastructure while delivering reliable, millisecond-latency insights to critical care teams. Therefore, we will next examine the data normalization and clinical terminology mapping required to standardize these inbound feeds.
How to Normalize Beaker Lab Data With Other ICU Signals
While FHIR provides structured transport, it does not eliminate the complex work of semantic normalization. Consequently, an Epic Beaker data integration ICU dashboard must reconcile disparate local laboratory naming conventions, measurement units, and timing discrepancies with bedside telemetry. Therefore, engineering teams must establish robust mapping pipelines before surfacing data at the point of care.
Semantic Terminology and Unit Harmonization
Local Epic test codes must map directly to standardized LOINC concepts. Meanwhile, physical measurement units require conversion using the Unified Code for Units of Measure (UCUM) standard.
- Terminology Mapping: Map internal laboratory master file entries (EAP/LRX) to discrete LOINC identifiers.
- Unit Standardization: Normalize disparate units, such as converting milligrams per deciliter to millimoles per liter.
- Reference Ranges: Preserve age-, sex-, and site-specific reference bounds alongside numerical values.
- Flag Translation: Standardize local laboratory severity flags into unified low, high, and critical alert tiers.
Temporal Reconciliation and Provenance
Laboratory results contain multiple conflicting timestamps that must be properly aligned against bedside monitors and ventilator feeds.
- Timestamp Alignment: Anchor longitudinal trends to specimen collection time rather than laboratory verification time.
- Lifecycle Handling: Manage preliminary, amended, and canceled results without leaving stale data on the screen.
- Duplicate Suppression: De-duplicate repeat message broadcasts using accession numbers and order IDs.
- Cross-Source Correlation: Synchronize Beaker results with ADT bed tracking, eMAR administrations, and infusion pump data.
Dashboard Freshness Targets
To maintain clinical trust, architectures should define explicit data latency agreements across diverse feeds.
| Data Type | Ingestion Source | Dashboard Freshness Target |
| Critical Lab Result | Epic Beaker (ORU^R01) | Sub-minute (<60 seconds) |
| Standard Chemistry Panel | Epic Beaker (FHIR/HL7) | 1–2 minutes |
| Bedside Vital Signs | Philips / GE / Dräger Monitors | 2–5 seconds |
| Medication Administration | Epic eMAR (OMP^O09) | 1–2 minutes |
| ADT / Bed Status | Epic ADT (ADT^A08) | Sub-minute (<30 seconds) |
| Longitudinal Trends | Aggregated Clinical Store | 5–15 minutes |
Note: These latency thresholds serve as engineering design targets and must be validated against institutional governance policies.
Furthermore, for a deeper breakdown of healthcare data pipeline security, see our guide on AI in Healthcare: Use Cases, Benefits & Security Protocols.
Consequently, rigorous semantic normalization ensures that predictive models and clinicians evaluate accurate, aligned physiology. Next, we explore the clinical decision support and alert architectures that turn this normalized data into actionable care pathways.
How AI Can Use Beaker Data for ICU Decision Support
Machine learning models turn raw laboratory streams into actionable early warnings by correlating discrete biochemical shifts with physiological deterioration. Integrating an Epic Beaker data integration ICU dashboard enables algorithms to detect multi-organ failure hours before standard clinical thresholds are triggered.
However, raw data feeds must undergo strict feature engineering and validation to prevent false alarms.
1. Predictive Feature Sets in Critical Care
Predictive models combine discrete Beaker results with continuous telemetry to identify acute syndromes.
- Sepsis Trajectory Prediction: Combines serial lactate clearance, WBC counts, and blood culture positivity with mean arterial pressure, heart rate, and vasopressor administration.
- Acute Kidney Injury (AKI) Forecasting: Correlates 48-hour serum creatinine velocity and eGFR drops with cumulative fluid balance and hourly urine output.
- Physiological Deterioration & Mortality: Synthesizes ABG trends, troponin, and platelet counts with bedside ventilator waveforms to forecast ICU length of stay.
- Unstructured Data Synthesis: Applies natural language processing to preliminary microbiology reports to summarize resistant pathogens for critical care teams.
2. Operational Machine Learning Governance
Feeding raw laboratory values directly into an algorithm does not create reliable intelligence. Instead, clinical engineering teams must establish strict validation pipelines.
- Temporal Alignment: Models must anchor inputs to exact specimen draw timestamps rather than delayed lab verification times.
- Missing Data Imputation: Missing-value strategies must account for clinical sampling bias without inventing false normal values.
- Drift Monitoring & Calibration: Real-time pipelines must continuously track model calibration across changing patient demographics.
- Explainability Interfaces: Dashboards must surface feature-attribution weights so intensivists can independently review risk scores.
3. Regulatory and Safety Compliance
Under the ONC HTI-1 framework, predictive decision support interventions (DSIs) must meet strict algorithm-transparency requirements. Developers must expose training data sources, validation metrics, and known performance limitations to clinical end users.
Furthermore, FDA Clinical Decision Support guidance separates non-device CDS tools from software functions subject to medical device oversight. Therefore, the software must enable clinicians to independently review the underlying diagnostic basis rather than delivering black-box mandates.
For a deeper breakdown of compliant healthcare machine learning, see our guide on Healthcare App Development: A Complete Guide.
Consequently, coupling governed AI algorithms with normalized Beaker streams delivers reliable clinical alerts without causing alert fatigue. Next, we outline the complete step-by-step implementation guide to deploy this integration in production.
HIPAA, Security, and Governance for Beaker ICU Data
Deploying an Epic Beaker data integration ICU dashboard requires an enterprise security architecture that satisfies statutory mandates and institutional procurement standards. Consequently, engineering teams must isolate electronic Protected Health Information (ePHI) across every ingestion gateway, cache cluster, and visualization layer.
The U.S. Department of Health and Human Services (HHS) mandates technical safeguards under the HIPAA Security Rule, including access control, audit controls, integrity mechanisms, person authentication, and transmission security.
Furthermore, hospital legal frameworks require comprehensive Business Associate Agreements (BAAs) with clear incident response boundaries.
- Access Governance: Enforce Role-Based Access Control (RBAC) and least-privilege OAuth 2.0 scopes. Clinician sessions authenticate via institutional SSO, while backend ingestion microservices use mTLS and rotating cryptographic secrets.
- Cryptographic Controls: Encrypt all Beaker telemetry in transit using TLS 1.3. Additionally, mandate AES-256 encryption at rest for time-series stores and ephemeral Redis caching layers.
- Audit & Forensics: Generate immutable, append-only audit logs capturing every patient chart view, lab query, and CDS alert interaction to satisfy compliance retention policies.
- Tenant Isolation: Enforce logical multi-tenant separation with container-level network policies to prevent cross-facility data leakage.
Hospital compliance teams strictly distinguish federal legal mandates from commercial assurance frameworks. At the same time, HIPAA, BAA execution, and FDA requirements represent non-negotiable federal laws. In contrast, SOC 2 Type II reports, HITRUST certifications, and external penetration tests serve as procurement benchmarks that validate operational rigor.
For a deeper breakdown of compliant infrastructure planning, see our guide on AI Compliance Software Development Cost Guide.
Establishing these technical safeguards ensures continuous regulatory alignment and safeguards critical patient telemetry. Therefore, we will next examine the complete financial breakdown and resource model required to build this integration.
How to Implement Epic Beaker ICU Dashboard Integration In 7 Steps
Executing an Epic Beaker data integration ICU dashboard requires an agile, phased engineering approach that bridges clinical workflow with enterprise infrastructure.
Consequently, hospitals must align clinical stakeholders, integration engineers, and compliance teams before moving code into production.
Step 1: Map ICU Workflows and Define the Clinical Data Contract
Step one defines the clinical governance boundaries, required lab parameters, and latency thresholds across key stakeholders.
Therefore, hospital IT teams avoid building redundant data pipelines by formalizing data schemas before designing UI components.
- Stakeholder Alignment: Convene intensivists, critical care nurses, clinical pharmacists, laboratory directors, and Epic interface analysts.
- Data Contract Specifications: Define required Beaker test codes, expected update intervals, abnormal value thresholds, and alert ownership rules.
- Patient Correlation Rules: Establish strict patient matching parameters to tie incoming lab accessions to active bed assignments.
Intellivon establishes a source-to-screen data contract upfront, mapping every clinical parameter to its upstream Epic source before writing application code.
This clarity prevents schema drift during downstream development.
Step 2: Configure Epic Access and Ingestion Endpoints
Step two establishes secure communication channels between Epic environments and the external dashboard data gateway. Specifically, engineers provision developer sandbox credentials, configure OAuth profiles, and validate MLLP network routes.
- Environment Provisioning: Access open.Epic developer tools, configure test sandboxes, and map staging endpoints.
- Authentication Scopes: Configure SMART on FHIR launch profiles, clinician SSO tokens, and system-level backend OAuth 2.0 credentials.
- Interface Provisioning: Open MLLP ports for HL7 v2 ORU^R01 laboratory streams and establish firewall rules.
Intellivon validates endpoint availability and network firewall routes before locking the architecture, preventing deployment delays during production handoffs. Next, the pipeline begins ingesting live message feeds.
Step 3: Ingest, Normalize, and Buffer Real-Time Data Streams
Step three normalizes raw laboratory outputs and correlates them with streaming bedside telemetry inside a centralized buffer. Consequently, incoming feeds are harmonized into a unified data structure for rapid consumption.
- Stream Parsing: Parse incoming HL7 OBX segments and ingest FHIR Observation resources concurrently.
- Semantic Mapping: Map proprietary Epic test codes (EAP/LRX) to standardized LOINC identifiers and convert units to UCUM.
- Queue Management: Buffer burst transaction loads across Kafka message queues equipped with dead-letter retry logic.
Intellivon preserves raw incoming payloads in an immutable data lake while routing a normalized clinical schema to real-time microservices. This design ensures full diagnostic auditability across all processed records.
Step 4: Aggregate Multi-Source Telemetry and Bedside Signals
Step four connects normalized Beaker lab metrics with live device telemetry, electronic medication records, and nursing documentation. Thus, the system creates a unified physiological timeline for every critical care bed.
- Device Synchronization: Ingest high-frequency streams from Philips, GE, and Dräger monitors alongside ventilator metrics.
- Medication Correlation: Map eMAR administration timestamps to detect drug-induced renal or hepatic shifts.
- Flowsheet Alignment: Ingest fluid balance metrics and nursing intake/output records to track volume status.
Intellivon deploys high-throughput ingestion microservices that correlate discrete laboratory results with continuous physiological parameters. This synthesis enables accurate multi-parameter clinical alerting.
Step 5: Embed Predictive Clinical Decision Support Models
Step five layers validated machine learning models and deterministic alert rules on top of the normalized data store. As a result, algorithms generate actionable early warnings for clinical deterioration.
- Model Inference: Run containerized ONNX models to predict sepsis onset, AKI development, and mortality trajectories.
- Alert Prioritization: Implement dynamic filtering to suppress non-actionable alarms and reduce clinical fatigue.
- Explainability Views: Surface underlying physiological drivers and lab trajectories directly within the alert interface.
Intellivon structures decision support tools with strict human-in-the-loop controls, providing clear clinical rationales for every algorithmic prediction. Consequently, providers maintain complete diagnostic oversight.
Step 6: Build Role-Based Clinician Dashboards
Step six delivers tailored, low-latency user interfaces optimized for intensivists, bedside nurses, and clinical pharmacists. Therefore, end users receive role-specific insights without visual clutter.
- Unit-Level Census: Display multi-patient priority matrices highlighting critical lab flags and deterioration risks across the unit.
- Patient Trajectory Views: Render sub-second time-series trend lines comparing serial labs against hemodynamic shifts.
- Workflow Embedding: Integrate views directly into Epic Hyperdrive workspaces using SMART on FHIR containers.
Intellivon builds responsive, dark-mode-optimized clinical interfaces powered by WebSockets to ensure zero-latency metric updates. These customized views streamline multidisciplinary rounding workflows.
Step 7: Validate, Launch, and Monitor the Integration
Step seven validates end-to-end data fidelity, system throughput, and downtime failovers prior to clinical deployment. Ultimately, a staged rollout guarantees patient safety and system reliability.
- Clinical Concordance Testing: Verify data fidelity by comparing dashboard outputs against native Epic Beaker charts.
- Stress & Failure Simulation: Execute load tests and simulate interface network dropouts to validate failover buffering.
- Phased Go-Live: Roll out the dashboard to a single pilot ICU pod before executing an enterprise-wide deployment.
Intellivon treats implementation as a clinical-systems deployment rather than a conventional software release, providing 24/7 go-live support.
Furthermore, for a deeper breakdown of full-scale system delivery, see our guide on Healthcare Software Development: A Complete Guide for 2025.
Following these seven structured steps ensures a robust, compliant, and clinically validated integration. Next, we analyze the financial investment, infrastructure costs, and resource allocation required for build versus buy strategies.
Epic Beaker ICU Dashboard Cost, Timeline, and Build vs Buy
A custom Epic Beaker data integration ICU dashboard typically costs $70,000–$300,000, depending on integration depth, the number of ICU data sources, Epic configuration, alerting requirements, AI functionality, and deployment scale.
Consequently, engineering teams must evaluate their technical requirements against these planning estimates rather than assuming fixed vendor pricing.
Epic Beaker ICU Dashboard Cost
| Development Phase | Scope & Deliverables | Estimated Cost (USD) |
| Discovery & Clinical Workflow Mapping | Stakeholder alignment, clinical data contracts & source inventory | $5,000–$15,000 |
| Epic Beaker / FHIR / HL7 Integration | Interface engines, MLLP endpoints, OAuth 2.0 & SMART launch | $15,000–$45,000 |
| Data Normalization & Core Backend | LOINC mapping, UCUM normalization, message queues & cache | $15,000–$50,000 |
| ICU Dashboard UX & Role Views | Responsive multi-patient census & single-bed trajectory UI | $10,000–$30,000 |
| Alerting, CDS & AI Engine | Deterioration rules, sepsis/AKI models & explainability layer | $5,000–$55,000 |
| Security, Validation & Deployment | HIPAA hardening, concordance testing & go-live support | $10,000–$35,000 |
| Cloud, DevOps & Observability | CI/CD pipelines, Kubernetes orchestration & log monitoring | $10,000–$30,000 |
| Multi-Site / Medical Device Expansion | Bedside monitor, ventilator & multi-facility scaling | $0–$40,000 |
| Total Initial Estimated Investment | Comprehensive end-to-end production deployment | $70,000–$300,000 |
Note: These figures represent custom software development planning benchmarks rather than official Epic licensing fees.
Additionally, annual ongoing maintenance typically ranges from 15% to 25% of the initial build cost. This operational budget covers Epic version upgrades, terminology mapping updates, interface monitoring, security patches, continuous MLOps calibration, and cloud hosting infrastructure.
Implementation Timelines and Governance
Delivery velocity depends on technical scope and institutional review speed.
- Beaker-Centric MVP (12–16 weeks): Establishes core HL7/FHIR feeds, LOINC normalization, and basic multi-patient trajectory views.
- Multi-Source Production Dashboard (16–24 weeks): Integrates bedside telemetry, ventilators, eMAR feeds, and role-based workflows.
- Enterprise Multi-ICU + AI Rollout (20–32 weeks): Deploys predictive CDS models, automated clinical alerting, and multi-unit scaling.
However, enterprise IT governance and health-system approvals frequently extend calendar delivery times. Hospital security reviews and interface provisioning often take 3 to 6 months to approve before developers can initiate the live API build.
Furthermore, for a deeper breakdown of medical platform engineering economics, see our guide on Healthcare AI Solutions for Enterprise Systems.
Ultimately, understanding these cost factors and approval timelines enables leadership to balance internal development resources against specialized external engineering partners.
How Intellivon Builds Beaker-Integrated ICU Dashboards
Building an Epic Beaker data integration ICU dashboard requires an engineering partner that treats clinical context, reliability, and security as foundational architecture rather than afterthought add-ons.
Consequently, Intellivon builds custom clinical dashboards designed for high-availability production environments.
- Clinical Workflow First: We map specific data requirements for intensivists, nurses, pharmacists, and lab teams before selecting interface protocols.
- Hybrid Interoperability Engine: We unite HL7 v2 real-time result streams with RESTful FHIR R4 resources across existing hospital systems.
- Normalized Data Layer: We decouple Epic-specific interface logic from the core clinical presentation and analytical rules engines.
- Production Reliability Architecture: We build distributed message buffering with Kafka, dead-letter retry queues, and automated disaster recovery.
- Sub-Second Streaming: We deliver real-time bedside updates using event-driven WebSockets and optimized in-memory Redis caching layers.
- Optional Decision Support Layer: We deploy predictive ML models as modular clinical services rather than forcing algorithms as mandatory dependencies.
- Compliance by Architecture: We implement RBAC, mTLS, TLS 1.3 encryption, and immutable audit logs directly into infrastructure blueprints.
- Concordance Validation: We execute side-by-side data verification against native Epic charts before initiating staged clinical rollouts.
Ready to deploy a custom, compliant ICU dashboard for your hospital network?
Book a 30-minute technical strategy call with Intellivon’s healthcare integration engineers to scope your clinical architecture and integration roadmap.
Conclusion
Successful Epic Beaker data integration ICU dashboard deployments do not begin with front-end graphs or UI widgets. Instead, reliable systems start with disciplined architecture: mapping clinical workflows, establishing data ownership, selecting optimal interface pathways, and enforcing semantic normalization.
Furthermore, clinical engineering teams must lock in strict latency targets, patient attribution models, alert governance policies, and HIPAA security controls before building user interfaces.
FAQs
Q1. Can Epic Beaker FHIR APIs provide real-time ICU lab data?
A1. FHIR R4 APIs excel at structured, on-demand reads for specific patient encounters. However, high-volume ICU alerting often requires event-driven HL7 v2 ORU^R01 pushes over MLLP. Therefore, engineering teams should evaluate latency requirements rather than assuming a single interface fits every clinical workflow.
Q2. Which Epic Beaker FHIR resources does an ICU dashboard need?
A2. An ICU dashboard primarily consumes Observation for laboratory values and DiagnosticReport for microbiology results. Additionally, applications query Patient and Encounter resources for census tracking, alongside ServiceRequest for pending orders. Consequently, these standardized objects supply comprehensive diagnostic context.
Q3. Can Clarity or Caboodle power a real-time ICU dashboard?
A3. Clarity and Caboodle provide substantial value for retrospective cohort analytics, quality reporting, and clinical AI model training. However, because both systems rely on scheduled batch ETL pipelines, they cannot deliver sub-minute data freshness. Therefore, live clinical alerting must rely on real-time interface streams.
Q4. Should a hospital build a custom dashboard or use Epic tools?
A4. If your clinical use case operates entirely within native EHR workflows, Epic’s built-in tools remain the logical starting point. In contrast, hospitals should build custom dashboards when they require multi-source device aggregation, cross-vendor telemetry synchronization, or proprietary AI-driven clinical decision support algorithms.
To Sum It Up
- A real-time ICU dashboard should not treat FHIR and HL7 as competing standards. Therefore, most of the production architectures need different paths for different latency and volume requirements.
- A Beaker result is not merely a number. Result status, units, reference ranges, timestamps, provenance, and amendments determine whether that number is clinically safe to display.
- Clarity and warehouse data can answer historical questions. Consequently, critical-care workflows need integration paths designed around the freshness clinicians actually require.
- Adding AI before fixing patient matching, terminology mapping, and result lifecycle handling creates a smarter-looking dashboard, but not necessarily a safer one.
- The $70K dashboard and the $300K dashboard usually differ less in visual design than in integrations, validation, alerting, availability, and clinical governance.