Key Takeaways:
- Emissions management platforms collect Scope 1, 2, and 3 activity data and apply GHG Protocol calculation logic.
- Emissions factor libraries, supplier input validation, and CDP, TCFD, CSRD, SBTi, and PCAF mapping are required.
-
AI models, audit trails, reporting automation, and SEC-readiness workflows ensure production-grade compliance governance.
-
Custom enterprise builds cost $70,000 to $300,000 depending on Scope 3 depth and integration complexity.
-
How Intellivon builds emissions management as production-grade data infrastructure.
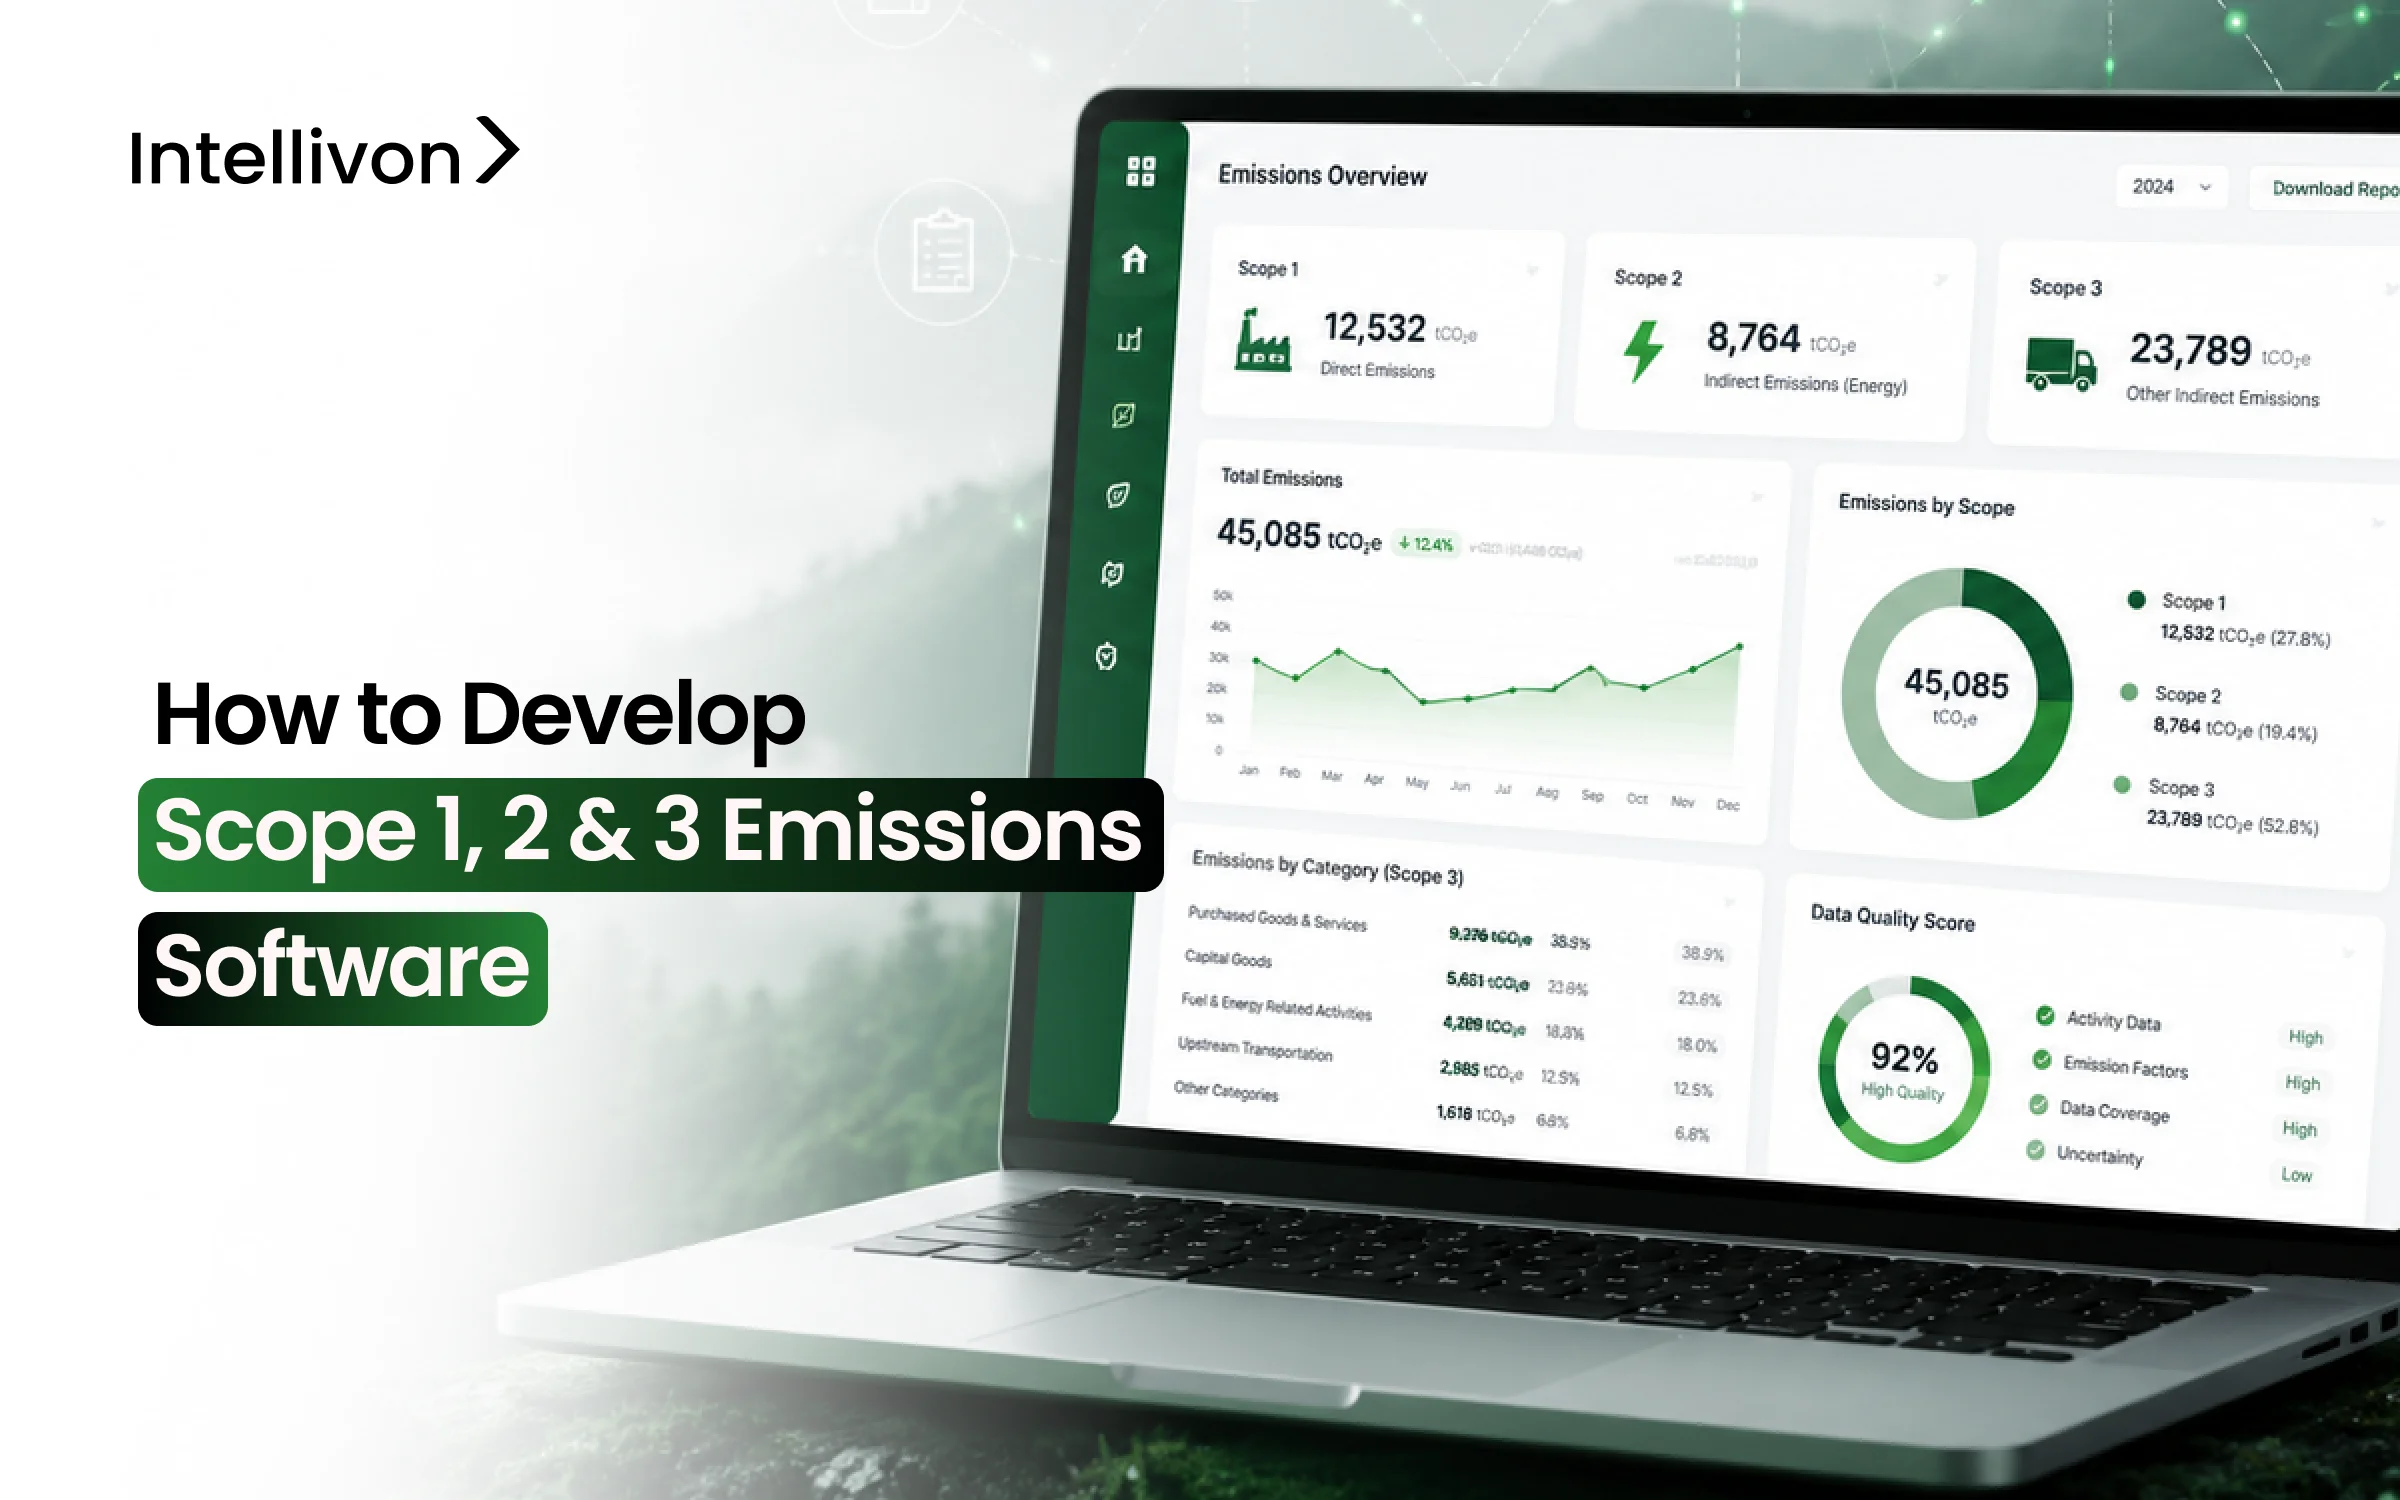
Developing Scope 1, 2, and 3 emissions management software starts with the GHG Protocol methodology layer, which acts as the foundation everything else is built on. Once that layer is in place, energy, procurement, supplier, and fleet data connects to the right calculation method for each scope, with Scope 3 requiring a separate architecture across all 15 emission categories.
This is where development projects go over budget, because teams build Scope 1 and 2 first and try to add Scope 3 afterward. Scope 3 needs supplier data portals, spend-based calculation engines, and separate emissions factor databases that cannot be refitted into an existing Scope 1 and 2 architecture, making a full data layer rebuild unavoidable. The GHG Protocol reports that 83% of companies struggle to access accurate Scope 3 data, a problem rooted in this same architectural decision.
Intellivon has spent over a decade building compliance-grade emissions platforms for healthcare and financial services, always starting with Scope 3 architecture first. This blog walks through the full build from GHG Protocol methodology through emissions factor databases, AI models, and costs from $70,000 to $300,000, ending with a clear blueprint to commission this platform.

What is Emissions Management Software?
Emissions management software is like a smart digital tracker for a company’s pollution. It automatically grabs real-world data, like electricity bills, fuel receipts, and delivery truck miles, and calculates exactly how much greenhouse gas the company is putting into the air.
Instead of using messy math on spreadsheets, it gives the company an exact, automated scorecard of their total environmental impact so they can show the government and the public they are cleaning up their act
Why Scope 1, 2 And 3 Need One Single Software
An enterprise emissions platform must unify Scope 1, 2, and 3 data because these distinct categories share identical foundational business metrics.
Consolidating them into a single system prevents duplicate inputs, mismatched calculation rules, and conflicting corporate disclosures.
- Scope 1 (Direct Operations): It tracks your owned assets, like company vehicles or natural gas boilers, linking fuel consumption directly to emissions.
- Scope 2 (Purchased Energy): It monitors your electricity use, applying location-based and market-based factors to your utility bills.
- Scope 3 (Supply Chain): It aggregates upstream supplier data and downstream product use, using the same procurement records from your Scope 1 and 2 tracking.
- Unified Reporting Accuracy: The single system guarantees your final data matches perfectly across different frameworks like CDP, CSRD, and SBTi.
Why Enterprises Need Scope 1, 2 And 3 Emissions Software
Enterprises need Scope 1, 2, and 3 emissions software because Scope 3 emissions are usually the largest and hardest part of the inventory, while enterprise reporting now requires auditable, repeatable, multi-framework carbon accounting.
In fact, Scope 3 emissions account for about 75% of a company’s overall emissions on average and can reach 79% of total emissions in large datasets, which is why spreadsheets break down quickly at scale.
1. ROI Comes From Fewer Rework Cycles
Automation drastically reduces manual reporting hours while accelerating formal disclosure timelines across complex enterprise systems.
If you want the ROI of building such a platform in plain numbers, here it is: Deploying a custom system yields a verified 345% ROI and achieves a rapid 4-month payback period for large organizations.
Specifically, independent research indicates that implementing custom automation eliminates the core bottlenecks that drain engineering resources.
- Drastic Workload Reduction: Automating data ingestion drops core calculation and validation workloads by up to 70% compared to traditional manual methods.
- Infrastructure Cost Savings: Consolidating fragmented apps into one integrated platform drives long-term infrastructure cost reductions exceeding 70%.
2. Regulatory Pressure Is Moving Beyond Annual Reporting
Global frameworks like the European Commission’s CSRD and California’s SB 253 push enterprises toward continuous, structured data collection.
Therefore, while the SEC paused federal Scope 3 mandates, cross-border and state laws still demand rigorous validation.
At the same time, platforms must provide flexible compliance mapping rather than hard-coded reports to handle these evolving standards.
3. Scope 3 Is the Real Data Engineering Challenge
Value chain footprints span 15 separate categories, including upstream suppliers, logistics, and capital goods. The fundamental challenge involves aggregating inconsistent vendor files, scoring data quality, and filling missing information gaps dynamically.
Custom systems replace blind spend-based averages with precise, activity-based calculation models over time.
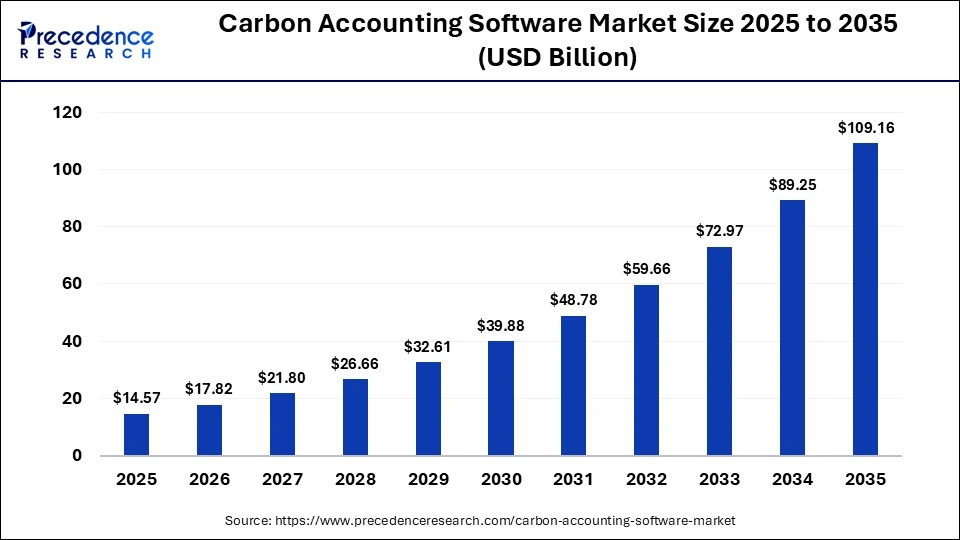
4. Market Growth
The global carbon accounting software market is experiencing rapid expansion due to tightening global compliance mandates. Specifically, the sector reached a valuation of USD 14.57 billion in 2025. Driven by enterprise demand, the market is projected to grow from USD 17.82 billion in 2026 to nearly USD 109.16 billion by 2035. This massive growth represents a compound annual growth rate (CAGR) of 22.31% over the nine-year period.
Therefore, engineering a unified platform creates reusable data streams that streamline external financial audits and procurement decisions. Ultimately, enterprises eliminate costly retrospective corrections by building these verifiable data pipelines from day one.
Carbon accounting systems have transformed from simple compliance checkmarks into core operational infrastructure. After establishing these baseline business needs, engineering teams must evaluate the underlying data architecture that makes a custom platform reliable.
Data Architecture For Enterprise Emissions Software Builds
Executing successful emissions management software development requires a highly decoupled, layered data architecture. Specifically, decoupling ingestion from calculation ensures your core reporting logic remains completely unaffected by chaotic supplier files or shifting regulatory frameworks.
Consequently, this defensive design pattern eliminates data duplication, protects auditing lineage, and provides a singular source of environmental truth across your enterprise.
End-to-End Core Platform Layers & Technology Stack
| Architecture Layer | Core Functionality & Data Requirements | Technical Stack & Tooling Integration |
| Layer 1: Data Ingestion & Source Connectors | Automated ingestion via public REST APIs, flat SFTP files, and direct database queries. Maps data across enterprise ERP systems, EHR utility loops, smart meters, fleet telematics, and external supplier data collection portals. | Kafka pipelines, AWS Lambda, Apache Airflow scheduling, secure Webhooks, and standard JSON schema validators. |
| Layer 2: Emissions Data Normalization | Transforms chaotic operational data into standardized unit formats (e.g., converting therms, kWh, and gallons to metrics). Aggregates multi-site facility identifiers, cost centers, and primary vs. secondary data matrices. | Apache Spark, Python Pandas dataframes, DBT data transformation models, and PostgreSQL staging schemas. |
| Layer 3: Calculation Engine & Method Library | Executes precise mathematical conversions utilizing multi-method logic. Houses custom formulas, Global Warming Potential (GWP) values, spend-based equations, and activity-based calculation models. | Rust calculation microservices, Redis computation caching, and isolated math.js processing environments. |
| Layer 4: Emissions Factor Database | Houses historical, current, and custom emissions factor library integrations. Controls algorithmic lookups across regional grids, ecoinvent profiles, and standard EPA emissions factor APIs. | PostgreSQL with strict temporal tables, Git-versioned factor libraries, and Elasticsearch index caches. |
| Layer 5: Reporting, AI, & Governance | Powers client-facing analytics, automated carbon disclosures, and anomaly alerts. Implements role-based access controls and isolates unverified activity data from formal audited pipelines. | React frontend, D3.js visualization engines, PyTorch anomaly models, Auth0 RBAC, and immutable audit logs. |
We build intelligent governance layers that combine strict, cryptographic audit logs with isolated frontend visualization zones. For a deeper breakdown of building enterprise compliance systems, see our guide on How to Build ESG Compliance Software for Enterprises.
Core data architecture dictates whether your platform becomes a trusted enterprise carbon ledger or remains just another basic reporting dashboard.
After establishing a defensible data structure, your engineering teams must map out the exact development roadmap required to bring the system online.
How To Build Scope 1, 2 And 3 Emissions Tracking Software
Building an enterprise carbon accounting platform requires translating complex greenhouse gas protocols into immutable database schemas and verifiable data pipelines. Specifically, a successful software build systematically transitions an organization away from un-auditable, manual spreadsheets toward automated, defensible data infrastructure.
Consequently, executing this engineering process in a strict, logical sequence ensures that the final platform delivers numbers that can comfortably withstand external financial and regulatory audits.
![]()
Step 1 — Define Boundaries and Inventory Rules First
Start by defining organizational boundaries, operational boundaries, reporting years, facilities, business units, emissions scopes, and inventory rules before writing platform logic.
Core Technical Requirements
- Organizational Control Logic: The system must programmatically execute calculations using either the operational control, financial control, or equity share approach based on the corporate legal structure.
- Temporal and Asset Baseline Mapping: Database schemas must enforce uniform reporting periods, manage historical base-year recalculation rules, and assign explicit approval owners to each asset.
- Inventory Management Plan (IMP) Generation: The software must automatically compile an immutable, version-controlled IMP document that tracks accounting boundaries and operational scopes over time.
Our Approach at Intellivon: We treat boundary definition as the core software blueprint.
Step 2 — Map Scope 1, 2, and 3 Data Sources
Map all emissions data sources before building dashboards because the platform can only calculate trusted emissions from trusted inputs.
Specifically, creating a decoupled ingestion registry prevents incoming data noise from polluting or slowing down the core analytical processes.
Ingestion Engine Features
- Unified Source Registry: Every incoming data stream requires a designated data owner, refresh frequency, explicit file schema, validation rules, and automated fallback methods for missing intervals.
- Data Ingestion Modalities: The platform architecture must natively support real-time REST APIs, scheduled SFTP flat-file drops, secure web forms, and direct webhooks.
Specialized Industry Ingestion Profiles
- Healthcare Networks: Software must ingest EHR energy and waste data integration healthcare streams, utility loops, medical refrigerants, volatile anesthetic gases, hospital fleet logs, and pharmaceutical procurement files.
- Fintech Platforms: Asset managers and banks require systems capable of ingesting large-scale loan books, investment holding files, counterparty carbon disclosures, and transaction sector classification codes.
Our Approach at Intellivon: We separate automated enterprise system integrations from minimum viable product (MVP) file-upload workflows. This strategy delivers immediate operational value within budget while ensuring the core architecture remains fully optimized for deep ERP and smart meter data integration down the road.
Step 3 — Select the Right Scope 3 Calculation Method
Scope 3 numbers feel inaccurate when the platform uses broad spend-based or revenue-based estimates without explaining the method, category, data quality, or upgrade path.
The fix is to develop Scope 3 emissions management platform logic that assigns the best available calculation method to each category and systematically improves data quality over time.
Scope 3 Calculation
| Scope 3 Calculation Method | Primary Input Variables | Technical Use Case Allocation | Audit Precision Tier |
| Spend-Based Engine | Financial ledger entries, procurement spend data, industry sector codes. | Early-stage value chain coverage; long-tail supplier estimations. | Tier 3 (Low Precision) |
| Activity-Based Model | Physical units (kWh, liters, metric tons, driven miles). | Material categories like logistics, distribution, and facility operations. | Tier 2 (Medium Precision) |
| Supplier-Specific Protocol | Direct vendor fuel use, primary utility data, verified product LCA metrics. | Strategic Tier 1 vendors, critical pharmaceutical inputs, high-impact medical devices. | Tier 1 (High Precision) |
Method Routing Logic
- Dynamic Method Selection: The engine must support spend-based, activity-based, average-data, supplier-specific, and hybrid emissions calculation methodology software switches on a per-line-item basis.
- Framework Accuracy Upgrades: Systems must treat spend-based methods as helpful starting proxies, while providing clear data pipelines to upgrade material categories to activity or supplier-specific data over time.
Our Approach at Intellivon:</span> We engineer a dedicated methodology routing layer. This modular design lets the platform apply different calculation methods by category, supplier, or asset class without requiring a complete rewrite of the core calculation logic.
Subsequently, after configuring your calculation routing rules, the software requires a highly structured emissions factor database layer to execute those conversions.
Step 4 — Design the Emissions Factor Database Layer
<p>The emissions factor database layer is the logic library behind the platform. It stores the factors used to convert activity, spend, fuel, energy, travel, supplier, product, and portfolio data into $CO_2e$, while preserving geography, year, source, methodology, and version history.
Therefore, this system must treat emissions factors as dynamic, highly versioned objects rather than static table entries.
Database Architecture Rules
- Multi-Registry Integration: The database must programmatically synchronize with the IPCC emissions factor library integration, EPA emissions factor API integration, ecoinvent database software integration, and localized regional grid datasets.
- Dual-Scope 2 Electricity Logic: The architecture must compute Scope 2 energy calculations using both location-based grid averages and market-based options like renewable energy certificates or power purchase agreements.
- Temporal Version Control: The platform must use strict temporal tables to prevent overwriting old factors silently, ensuring that historical reports can be reproduced exactly as they were initially filed.
Our Approach at Intellivon: We build this layer as an independent, containerized factor service using Git-versioned control logic. This guarantees total audit transparency and allows your carbon logic to evolve cleanly without corrupting past reporting cycles.
Consequently, with a version-controlled factor layer online, the architecture can feed clean variables into a fully transparent calculation engine.
Step 5 — Build a Transparent GHG Calculation Engine
A transparent GHG calculation engine should show exactly how each emissions number was produced. It must connect source data, calculation method, emissions factor, unit conversion, formula, reviewer status, and reporting output so teams can explain every number during internal review, board reporting, or verification.
Specifically, this completely eliminates the “black box” problem that frequently triggers compliance red flags during external reviews.
Multi-Scope Calculation Examples
- Scopes 1 and 2: The engine separates direct emissions from stationary combustion and mobile fleets from indirect location-based and market-based electricity calculations.
- Scope 3 Categorization: The processing loops segment outputs into 15 distinct categories including business travel, employee commuting, capital goods, and upstream distribution.
- System Microservices: For a deeper breakdown of modular engineering design patterns, see our guide on enterprise microservices architecture design.
Our Approach at Intellivon: We engineer calculations as an isolated microservice written in Rust. This design provides blazing-fast computation times across millions of transactional records while maintaining mathematical immutability for the user.
Therefore, once the calculations are performing reliably, the software must evaluate the structural integrity and trustworthiness of the incoming data points.
Step 6 — Add Scope 3 and PCAF Data Quality Scoring
Data quality scoring tells users how much confidence they should place in each emissions number. This is especially important for Scope 3 and financed emissions because those categories often rely on supplier data, estimates, averages, proxies, or incomplete value chain information.
Scoring Parameters
| Data Score (1-5) | Data Type | Source Origin | Audit Reliability |
| Score 1 | Primary Data | Verified supplier emissions or direct utility invoices | Highest Confidence |
| Score 3 | Secondary Data | Physical activity units scaled by regional proxy averages | Moderate Confidence |
| Score 5 | Proxy Data | Spend-based financial estimates and sector economic metrics | Lowest Confidence |
Our Approach at Intellivon: We build data quality scoring mechanics directly into the core calculation loop. This architectural guardrail prevents compliance teams from accidentally treating unverified spend estimates and primary supplier data with equal statistical weight.
Subsequently, when data quality scores are transparently established, the platform can deploy evidence workflows to prepare for formal external audits.
Step 7 — Build Verification-Ready Audit Workflows
A verification-ready emissions platform must preserve evidence, approvals, calculation history, factor history, methodology notes, and reviewer decisions.
Therefore, the platform acts as a secure data bridge between corporate operators and external financial assurance teams.
Governance Requirements
- Immutable Ledger Logging: The workflow engine must generate a comprehensive emissions data audit trail and lineage ledger that records every user adjustment, data override, and supervisory approval event.
- Isolated Verifier Environments: The platform must provide secure, role-based access control emissions platform permissions that allow external auditors to inspect calculation formulas and evidence files without exposing unrelated corporate data.
- Evidence Vault Architecture: Every activity record must support direct attachment uploads, including original utility PDF invoices, supplier survey certificates, and third-party verification statements.</span>
Our Approach at Intellivon: We build this governance block as a strict, enterprise-grade access layer utilizing single sign-on (SSO) and role-based access control.
Step 8 — Automate Data Collection and AI Review Carefully
Automation should reduce manual emissions work without weakening control over final numbers.
The safest platform automates data imports, supplier reminders, document extraction, anomaly detection, missing-field alerts, report drafting, and forecasting while keeping methodology approval and final disclosure review with human owners.
Specifically, AI acts as an intelligent quality buffer rather than a black-box decision maker.
Smart Automation Target Areas
- Intelligent Anomaly Detection: Predictive emissions forecasting AI models analyze historical consumption baselines to instantly flag outlier values, data entry duplication, or unexpected drops in supplier data streams.
- Unstructured Data Processing: Integrated NLP supplier sustainability data extraction modules process incoming vendor documents, carbon disclosures, and invoicing sheets to automatically pull out primary activity metrics.
- Safe Human-in-the-Loop Guardrails: Machine learning models are strictly confined to classification, estimation, and forecasting tasks. The system must never permit an AI model to silently alter emissions factors or authorize a final compliance disclosure without human review.</span>
Our Approach at Intellivon: We introduce advanced machine learning and automation capabilities only after your foundational data schemas, calculation microservices, and audit logs are fully verified. This design pattern ensures that your artificial intelligence remains completely explainable, accurate, and safe for heavily regulated corporate compliance tracking.
The step-by-step development of a custom corporate sustainability platform should never end with superficial visual dashboards. Ultimately, a successful software build concludes with ironclad trust.
Scope 3 Category Workflows The Platform Must Support
Specifically, it must function as a multi-layered value chain operating system that ingests fragmented vendor files, tracks capital assets, and handles downstream financed portfolios.
Consequently, this specific architecture allows compliance teams to systematically replace high-uncertainty financial proxies with primary, verified data over time.
Critical Scope 3 Architectural Workflows
- Upstream Categories (1-8): Track purchased goods and services emissions software data, capital goods, facility waste streams, and employee travel integrations. Healthcare systems specifically map clinical pharma procurement, medical supply chains, and complex hospital waste disposal.
- Downstream Categories (9-14): Model product use-phase energy consumption and end-of-life treatment. For medtech, this isolates medical device sterilization cycles, packaging disposal, and device end-of-life recycling paths.
- Category 15 Financed Emissions: Employs the PCAF standard to link investment portfolio data, asset classes, loan exposure ratios, and equity attribution logic for financial institutions.
- Continuous Data Quality Scoring: Grades individual transactional entries from 1 to 5 based on primary data share, factor specificity, and statistical uncertainty parameters.
- Supplier Engagement Engine: Automates vendor survey reminders, enforces data validation entry rules, and manages automated fallback calculations when primary data is missing.
Ultimately, Scope 3 tracking cannot be handled by a single, generic software module. Consequently, you must build it as a category-by-category value chain operating system that dynamically scales alongside your suppliers’ data maturity.
AI Capabilities That Improve Emissions Data Confidence
Integrating AI within an AI-powered Scope 3 emissions tracking software platform improves processing speed and limits data error rates across massive value chains.
Specifically, machine learning models function as automated validation buffers that classify unstructured records, isolate operational anomalies, and forecast future decarbonization pathways.
Consequently, deploying these intelligent data guardrails allows enterprise sustainability teams to transition away from labor-intensive manual reviews while maintaining absolute compliance control.
Key Applied AI Workflows & System Controls
- Document Processing & Classification:=”font-weight: 400;”> Uses specialized NLP supplier sustainability data extraction to pull exact activity metrics and assurance certificates directly from unstructured vendor PDFs and invoices.
- Operational Anomaly Alerts: Employs real-time emissions anomaly detection and alerting models to immediately flag baseline calculation spikes, data entry duplicates, or sudden supplier factor deviations.
- Decarbonization Forecasting:</b> Utilizes predictive emissions forecasting AI models to simulate future net-zero paths based on corporate expansions, procurement growth, or portfolio shifts.
- Production-Grade Engineering Frameworks: Implements strict MLOps and human review guardrails with explainability queues to ensure AI models never alter calculations without manual oversight.
Ultimately, AI must be utilized to validate, estimate, and audit your corporate footprint data rather than generate opaque calculations.
Consequently, establishing clear human-in-the-loop guardrails ensures your final environmental metrics remain completely transparent, defensible, and audit-ready.
Compliance Frameworks The Reporting Engine Must Map
Enterprise greenhouse gas emissions software development for enterprises must decouple core calculation data from specific reporting templates.
Specifically, the underlying architecture must maintain a dynamic translation layer that maps a single, validated dataset across multiple evolving global disclosure frameworks simultaneously.
Consequently, this specific engine configuration completely eliminates redundant manual reporting cycles and guarantees that every public climate statement remains anchored to an identical, auditable calculation history.
Critical Regulatory & Framework Workflows
- GHG Protocol Technical Implementation:yle=”font-weight: 400;”> Establishes the foundational structural logic for defining multi-tenant organizational boundaries, tracking seven separate greenhouse gases, managing base-year baseline resets, and calculating accurate metrics.
- Dual-Core Scope 2 Tracking: Engineers distinct concurrent pipelines for location-based grid intensity lookups and market-based tyle=”font-weight: 400;”>Scope 2 market-based location-based emissions software integration, natively matching direct supplier contracts, renewable certificates, and power purchase agreements.
- Global Framework Schema Mapping: Standardizes and pushes normalized data arrays directly into automated disclosures for CDP climate disclosure automation, TCFD Scope 3 reporting software, and CSRD Scope 3 disclosure compliance portals.
- Flexible U.S. Regulatory Readiness: Replaces hard-coded rule dependencies with a flexible config mapping layer, insulating enterprise architectures against major federal policy shifts like the SEC’s 2026 climate rule rescission proposal.
- Fintech PCAF Portfolio Routing: Deploys specialized asset-class mapping and exposure-based attribution models to compute downstream financed emissions footprint profiles under strict Category 15 mandates.</span>
Ultimately, regulatory compliance capabilities should exist entirely within a detached, fluid mapping layer rather than hard-coded into fixed spreadsheet scripts or static data exports.
Emissions Management Software Development Cost: $70K-$300K
Emissions management software development usually costs $70,000 to $300,000, depending on platform scope, integrations, and AI features.
Specifically, a focused Scope 1 and 2 MVP starts near $70,000, while a compliance-ready Scope 1 2 3 emissions SaaS platform development cost profile for global enterprises reaches $300,000.
1. Phase & Tier Cost Breakdowns
| Development Phase | Estimated Cost Range |
| Discovery, Boundary Setup & Integration Auditing | $16,000 – $38,000 |
| Architecture Design, Pipelines & API Data Connectors | $28,000 – $80,000 |
| Calculation Engine, Factor Library & Supplier Portals | $33,000 – $85,000 |
| Compliance Mapping, AI Quality Tier & Security UX | $39,000 – $113,000 |
| Security, QA, DevOps & Production MLOps Deployment | $12,000 – $35,000 |
2. Cost By Build Tier
| Build Tier | Cost Range | Key Structural Capabilities Included |
| Scope 1 & 2 MVP | $70,000 – $110,000 | Single-region operations, fuel/electricity tracking, basic CSV exports. |
| Integrated Platform | $120,000 – $190,000 | Multi-site ERP integration, waste/travel data, manual supplier forms. |
| AI Enterprise Platform | $200,000 – $300,000 | Full Scope 3, NLP extraction, PCAF fintech modules, immutable logs, MLOps. |
3. Ongoing Maintenance and TCO
Annual maintenance costs average 15% to 25% of the initial build fee. Therefore, a $200,000 enterprise tier platform requires an ongoing budget of $30,000 to $50,000 annually.
This operational investment covers emissions factor API synchronization, framework layout adjustments, and continuous model drift monitoring.
A $70,000 baseline build proves initial data pipeline utility for local operations. Ultimately, a global enterprise platform with deep Scope 3 value chain tracking, automated AI anomalies, and PCAF support requires a dedicated investment of $200,000 to $300,000.
Build Scope 1, 2, and 3 Emissions Software With Intellivon
Intellivon helps enterprises build emissions management platforms that connect operational data, and compliance reporting into one governed system.
The team designs custom platforms for healthcare, fintech, pharma, medtech, banks, insurers, and asset managers that need more than standard carbon accounting software.
- Scope 1, Scope 2, and Scope 3 architecture planning
- GHG Protocol calculation engine design
- Supplier emissions workflow development
- PCAF financed emissions module development
- AI anomaly detection and forecasting models
- CDP, TCFD, CSRD, SBTi, and SEC-readiness mapping
- Audit trails, RBAC, SSO, data lineage, and MLOps controls
Plan Your Emissions Software Architecture With Intellivon by booking a free consultation call with us.
Conclusion
Ultimately, successful emissions management software development requires treating carbon metrics as core operational infrastructure. Consequently, shifting from spreadsheets to a unified $70,000 to $300,000 platform delivers version-controlled calculation engines.
Therefore, this technical investment transforms raw value-chain data into verified, compliance-grade corporate intelligence across healthcare and financial enterprises.
FAQs
Q1. How much does emissions management software development cost?
A1. Developing custom carbon tracking solutions typically costs $70,000 to $300,000. Specifically, a baseline operational MVP costs $70,000 to $110,000. Consequently, adding advanced AI validation and automated supplier workflows pushes the final enterprise budget toward $300,000.
Q2. How long does it take to build Scope 1 2 3 emissions tracking software?
A2. Engineering a standard operational MVP generally requires 10 to 14 weeks. However, deploying an enterprise platform automated Scope 3 supply chain logic extends timelines to 5 or 9 months.
Q3. What makes Scope 3 emissions software development difficult?
A3. Value chain engineering is exceptionally challenging because required data resides outside direct corporate boundaries. Therefore, your software architecture must implement dynamic hybrid calculation models alongside granular, algorithmic data quality scoring pipelines.
Q4. Should enterprises build or buy emissions management software?
A4. Purchasing pre-built commercial software remains highly practical for simple annual reporting. In contrast, custom development becomes essential when integrating complex healthcare EHR systems or building proprietary, compliance-ready banking investment portfolio workflows.