Key Takeaways:
-
Figuring out which infections started in the hospital can get complicated. There’s info coming in from lab results, devices, patient charts, and even just tracking who was where. Bugsy tries to pull all that together, but it’s still a lot to sift through. Infection teams get a single place to look, which helps, but there are still a lot of moving parts.
-
Tracks things like CLABSI, CAUTI, MRSA, SSIs, C. diff, VAE, and all the other superbugs that seem to turn up. Not just in hospitals, either.
-
Bugsy gets used for a bunch of stuff. Teams look at outbreaks, check on who’s in isolation, keep an eye on antibiotics, and sort out NHSN reporting if it comes up.
-
No software is magic. Results depend on the data being right and the surveillance rules making sense. At the end of the day, someone still has to double-check cases to see if they actually count for reporting.
-
Intellivon often works on the extras, which could be new dashboards, maybe some automation, or adding AI features. Pricing is all over the place. Some jobs are simple and cheap, but big projects can go up to $300,000, not including whatever Epic charges for the software itself.
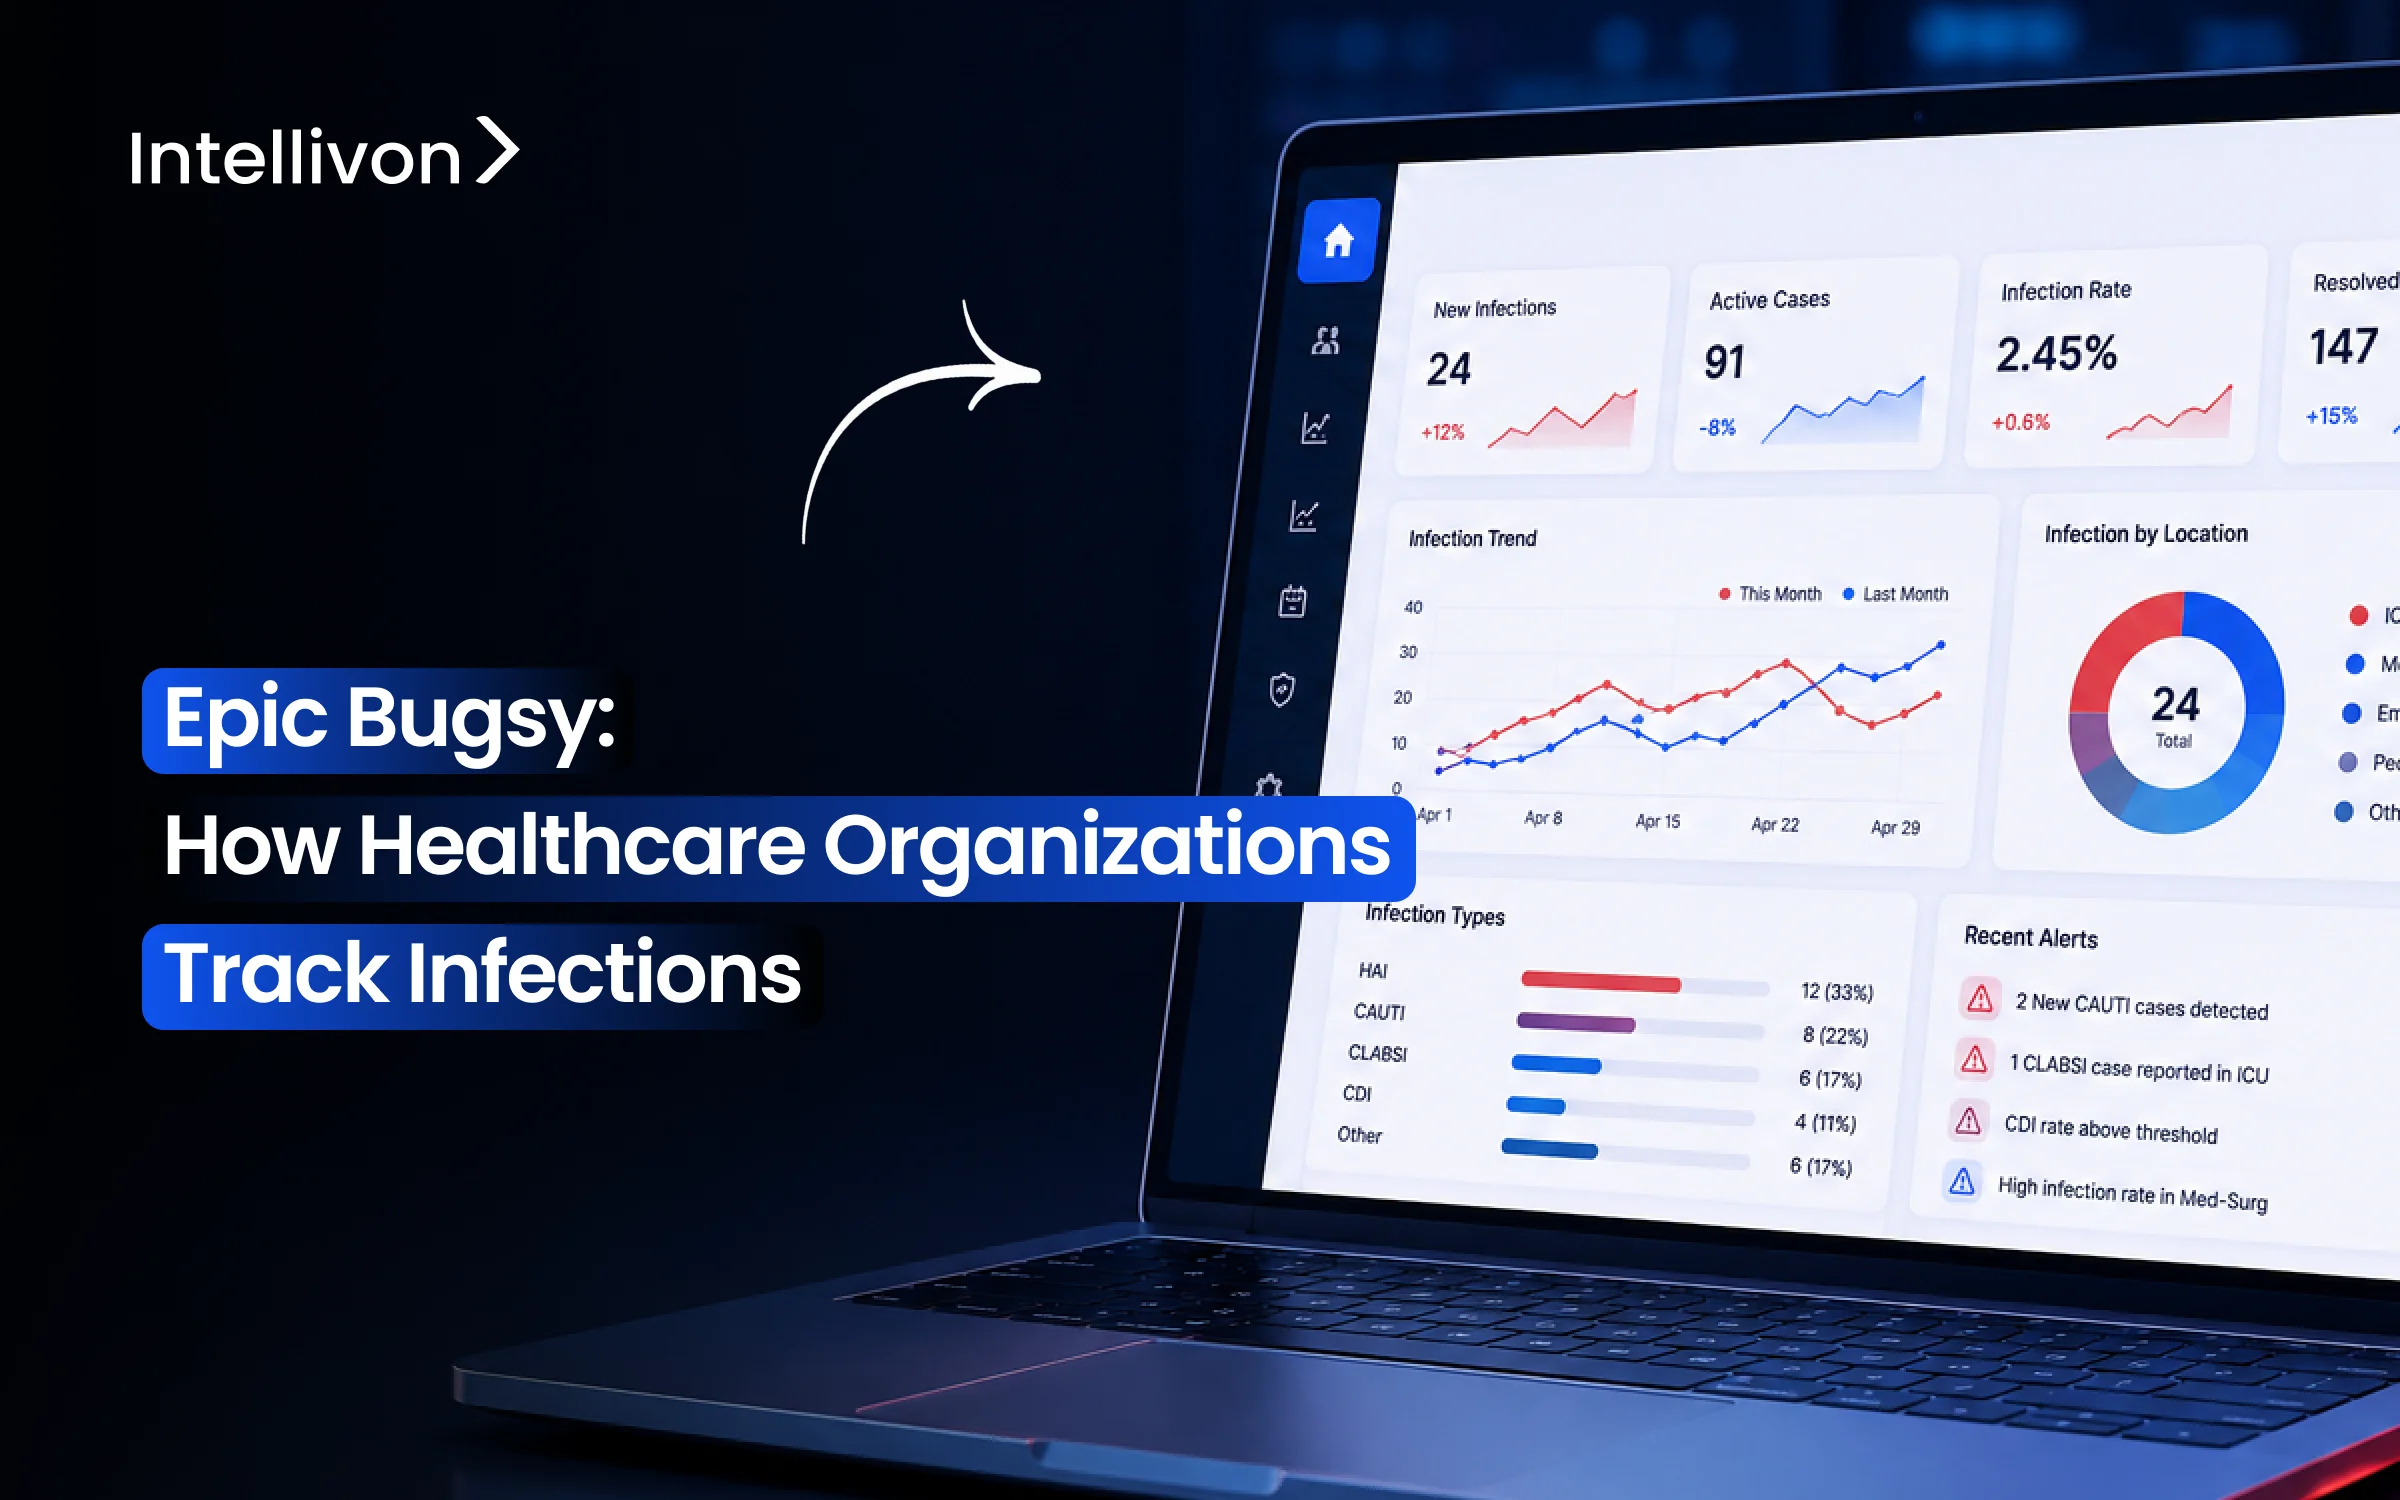
Infection preventionists currently spend more of their time hunting down lab results across different systems than looking at the cases which actually require their judgment. Epic Bugsy was created to alter this ratio, and to that effect, it is Epic’s infection surveillance module which brings together microbiology results, ADT data, and NHSN case definitions in a single workspace so that a positive culture appears automatically rather than having to wait for it to be spotted during a manual chart review.
Yet simply turning on Bugsy rarely manages to close all the surveillance gaps by itself. If the information from Beaker and the lab interfaces is not properly incorporated into the infection definitions, cases still manage to slip through, and as a result, preventionists are left having to carry out the same manual chart reviews that the module was meant to replace. However, when the case definitions and lab mapping are correctly configured, the benefits become evident in actual dollar terms: a single CLABSI case results in an average excess cost of $43,975 and 13.4 extra hospital days when detection and prevention are delayed.
We have previously translated lab feeds into NHSN definitions for infection prevention teams, and the lesson remains consistent each time: Bugsy only shows those things that the lab feed provides. Hence, this blog explains how Bugsy tracks infections throughout the entire process, from lab integration and outbreak detection to antimicrobial stewardship and NHSN reporting, so that you can see what a properly designed surveillance workflow picks up that a manual review fails to detect.

What Epic Bugsy Is and Where It Fits Inside the Epic EHR
Epic Bugsy is Epic’s infection-control application, built for infection-prevention teams that need surveillance, case review, trend analysis, and regulatory reporting inside one workflow. It is not a standalone analytics tool.
Instead, Epic places it inside its acute and inpatient ecosystem, next to the clinical modules that generate the data infection preventionists actually work from.
1. What Epic Bugsy Is Designed to Manage
Bugsy’s scope covers the full infection-prevention lifecycle, rather than just alerting.
- Infection surveillance across inpatient units
- Possible infection identification from lab and clinical data
- Infection-case documentation and investigation
- Infection population tracking and cohorting
- Isolation workflows and precaution status
- Trend and outbreak analysis
- Regulatory reporting, including NHSN
- Antimicrobial use and resistance workflows
Because these functions sit in one application, an infection preventionist moves from a lab flag to a documented case without switching systems. That single-workflow design is what most competing overviews skip entirely.
2. Which Healthcare Teams Work With Bugsy
Bugsy’s user base extends past infection control alone. Infection preventionists and infection-control nurses use it daily, while hospital epidemiologists rely on it for trend and cluster review.
At the same time, antimicrobial stewardship pharmacists, quality teams, microbiology, pharmacy, clinical informatics, and Epic analysts all touch the same platform from different angles.
3. Where Bugsy Sits Beside Other Epic Applications
Bugsy does not generate lab results or clinical notes on its own. Rather, it pulls from Beaker for microbiology data, Willow for pharmacy and medication activity, and ClinDoc and Orders for clinical documentation. ADT feeds patient movement, which drives isolation and cohort logic directly.
For reporting and analysis, Bugsy connects to Cogito, Reporting Workbench, Radar, SlicerDicer, Clarity, and Caboodle, depending on whether a team needs a live dashboard or historical warehouse data.
Bugsy acts as an infection-prevention workflow layer over clinical information already moving through Epic, rather than a separate infection-surveillance system.
At the same time, it pulls from Beaker, Willow, ClinDoc, and ADT to power case management, then feeds Cogito and Clarity for reporting.
Which Healthcare Organizations Are the Best Fit for Epic Bugsy
Epic Bugsy fits best inside organizations that already run their clinical operations on Epic, since the platform depends on live ADT, lab, and medication data flowing from other Epic modules. Consequently, the strongest results appear where Epic already sits at the center of the technology stack, rather than as one system among several competing platforms.
The infection surveillance solutions market is expected to grow from $1.03 billion in 2026 to $1.9 billion by 2031, a 13.05% CAGR driven largely by AI-equipped detection tools.
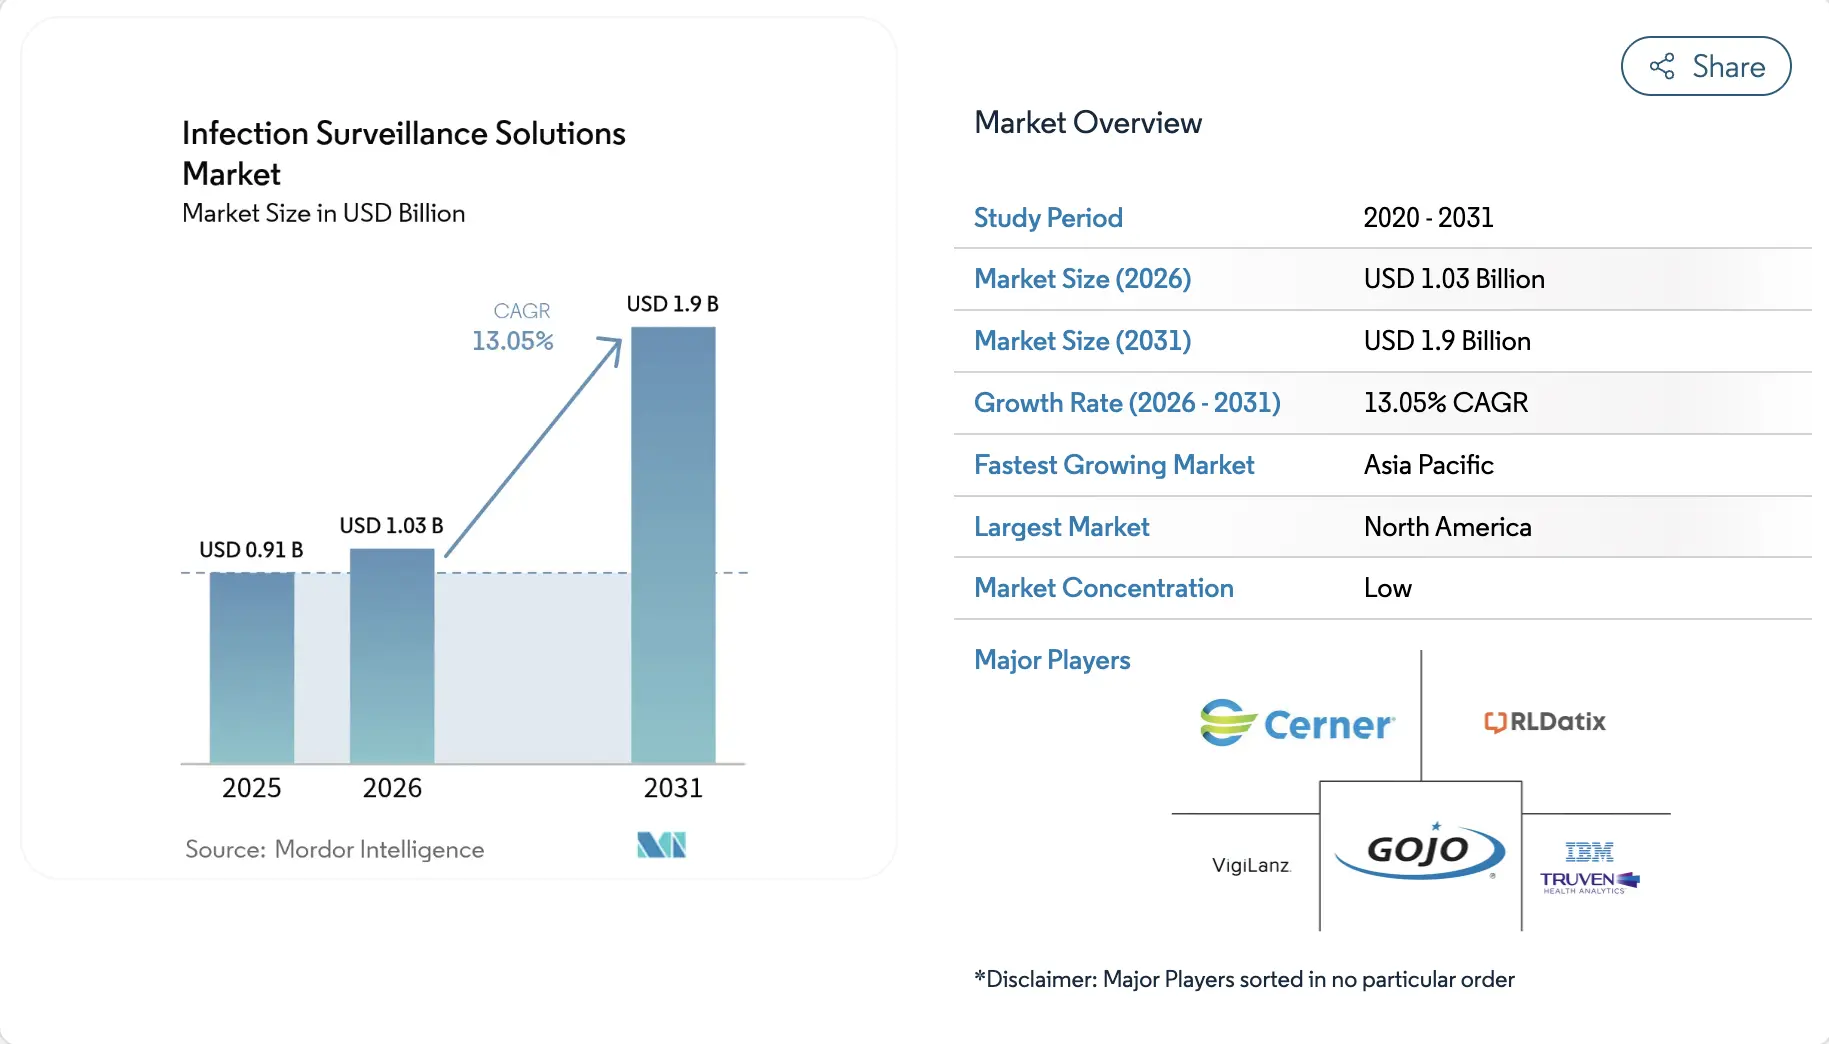
That growth signals rising pressure on infection-control teams to modernize, which makes fit assessment a real decision, not a formality.
1. Epic-Native Hospital Networks
Hospitals with ADT, labs, medication, procedures, documentation, devices, and locations already running through Epic see the fastest Bugsy adoption.
Because every data source Bugsy depends on already lives in the same system, integration work is minimal compared to mixed-vendor environments.
2. Academic Medical Centers
Academic centers bring complex HAI patterns across multiple ICUs, specialty populations, and research obligations, all of which Bugsy is built to handle.
Additionally, stewardship programs and layered reporting requirements make the platform’s case-management depth genuinely useful rather than excessive.
3. Integrated Delivery Networks
IDNs benefit from Bugsy’s ability to standardize infection-control workflows across multiple facilities under one build.
As a result, surveillance definitions and reporting stay consistent system-wide, instead of varying facility by facility.
4. Organizations With External LIS or Mixed Systems
Facilities running a separate lab information system or non-Epic clinical tools face heavier integration work before Bugsy performs well.
Since Bugsy’s alerting depends on clean, real-time lab and ADT feeds, mixed environments introduce mapping and latency issues that Epic-native builds avoid.
5. When Bugsy May Not Be the Best Standalone Choice
Multi-EHR networks, organizations with significant existing investment in third-party surveillance tools, or those with highly specialized surveillance needs may find Bugsy alone insufficient.
Similarly, limited Epic integration maturity reduces the platform’s core advantage before it ever reaches production.
Bugsy delivers the most value inside Epic-native, single-EHR environments where ADT, labs, and documentation already flow through one system.
Organizations with fragmented systems or specialized surveillance needs face a harder integration path, which is exactly the gap the next section’s comparison against other platforms addresses.
How Epic Bugsy Architecture Connects Infection Surveillance Data
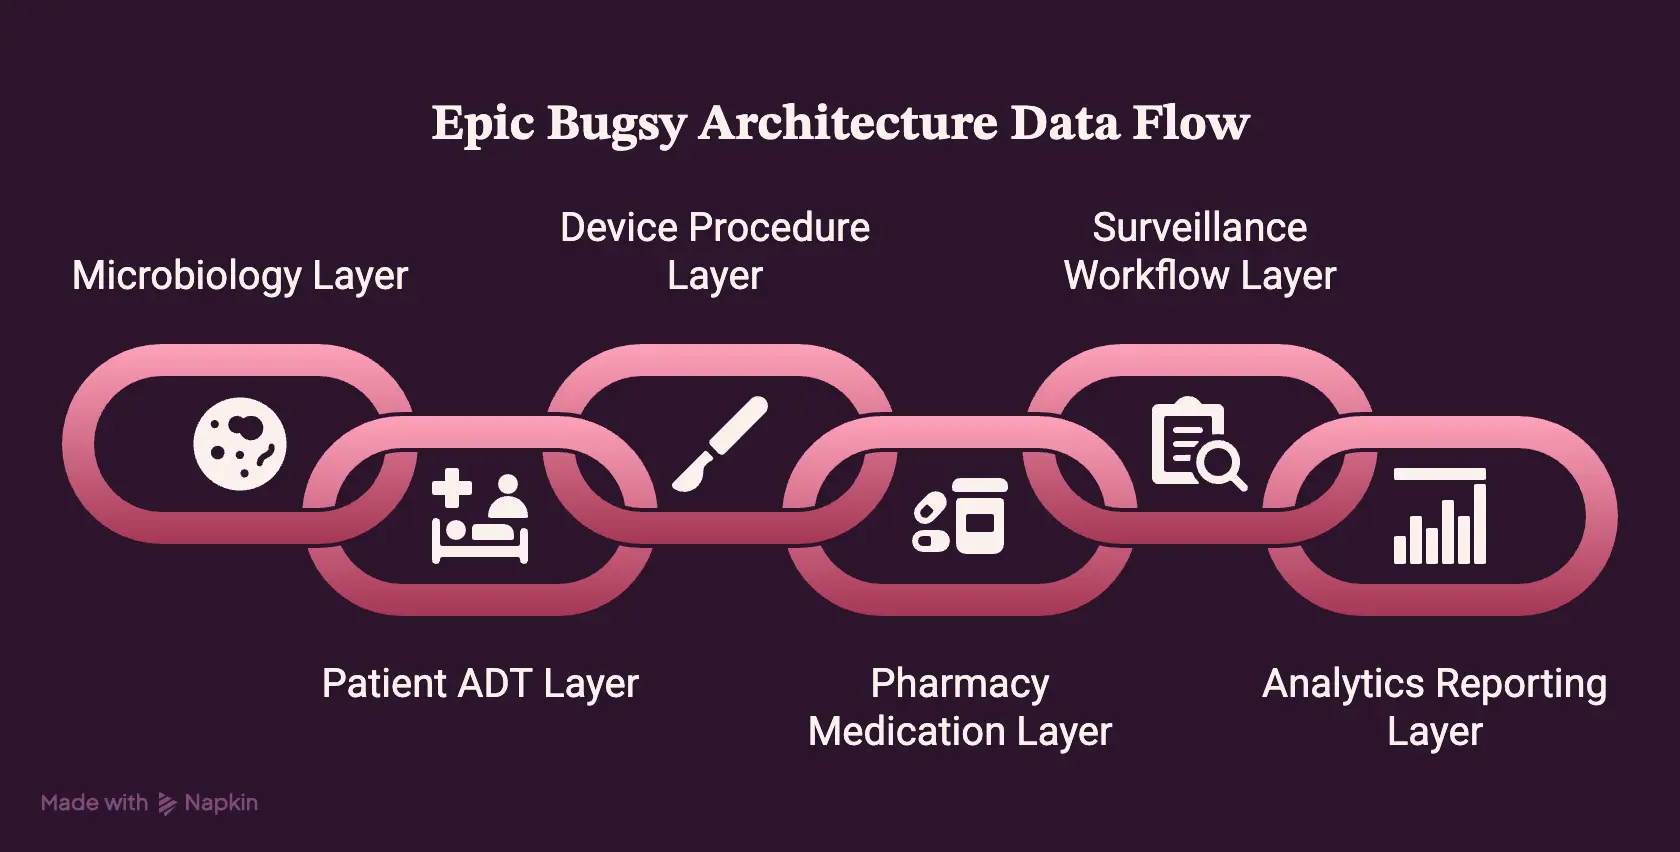
Epic Bugsy pulls from five distinct data layers before any infection review happens, moving from clinical systems through Epic’s core data model into Bugsy’s surveillance logic, then to IP review, and finally to reporting and analytics.
Understanding this flow matters first, because the workflow only makes sense once the data sources behind it are clear.
1. Microbiology and Laboratory Layer
Bugsy draws directly from culture results, organism identification, specimen type, and susceptibility data as they are posted. Molecular results and collection date and time feed the same layer, which anchors most infection candidate logic.
2. Patient and ADT Layer
Admission, discharge, transfer, department, unit, and bed data all flow into Bugsy through ADT feeds. This location history lets the system tie an infection event to a specific unit, which matters for outbreak and cluster analysis later.
3. Device and Procedure Layer
Central lines, urinary catheters, ventilation, surgery, and other procedures feed Bugsy’s device-associated infection logic. Michigan Medicine specifically described Bugsy evaluating microbiology data alongside line, drain, and airway documentation when identifying possible CAUTI and CLABSI events.
That combination of lab and device data is what separates real device-associated detection from a simple lab alert.
4. Pharmacy and Medication Layer
Antimicrobial orders, administrations, course duration, and indications all route through this layer.
Consequently, susceptibility context ties back to the microbiology layer, connecting prescribing decisions to the organism they were meant to treat.
5. Surveillance Rules and Workflow Layer
Data alone does not equal an infection determination. Instead, Bugsy assembles candidate events and routes them through workflow logic built around NHSN and CDC criteria.
At the same time, IP staff still review each candidate and apply surveillance criteria and clinical judgment before any case gets confirmed.
6. Analytics and Reporting Layer
Once a case is documented, information can flow to Radar, Reporting Workbench, SlicerDicer, Clarity, or Caboodle, depending on whether a team needs a live dashboard or historical trend data.
From there, some organizations extend into Power BI, Tableau, or custom analytics for board-level reporting.
Bugsy’s architecture pulls microbiology, ADT, device, and pharmacy data into one surveillance layer, then hands confirmed cases off to Epic’s broader reporting stack.
Because the system assembles candidates rather than confirming infections outright, the workflow layer covered next depends entirely on how well these upstream feeds are configured.
How Epic Bugsy Tracks an Infection From Signal to Closed Case
Epic Bugsy moves an infection candidate through seven steps, from an initial data signal to a closed, reportable case.
Consequently, each step depends on the one before it, so a gap early in the chain surfaces as a documentation gap later. This is the workflow every earlier architecture layer ultimately feeds.
Step 1 — Detect a Surveillance Signal
A surveillance signal fires when Bugsy identifies a result or event that matches its trigger logic. Importantly, this happens automatically, without infection-preventionist input at this stage.
Specifically, the signal draws from data already covered in the architecture layers above:
- Positive culture results
- Resistant organism identification
- Device-associated risk indicators
- Relevant procedures
- Isolation criteria
- Antimicrobial order signals
Intellivon’s approach: Instead of relying on Epic’s default trigger set, we configure signal logic against an organization’s actual device and unit inventory, since default thresholds often miss unit-specific risk patterns that only surface once real volume runs through the system.
Once a signal fires, it therefore needs somewhere to go, which is where candidate routing takes over.
Step 2 — Create or Route a Candidate for Review
A fired signal becomes a candidate case, subsequently routed into a worklist based on population rules. In other words, this step converts a raw data event into something an infection preventionist can actually act on.
Routing depends on a few configured factors:
- Unit and department assignment
- Patient population type
- Infection type and urgency
- Alert versus standard worklist placement
Intellivon’s approach: Because staffing structures vary widely between facilities, we build routing rules around each facility’s actual coverage model, so candidates land with the preventionist responsible for that unit instead of a generic shared queue. As a result, this single change reduces the review backlog most organizations underestimate at go-live.
With the candidate routed, the next step then applies the actual surveillance definition.
Step 3 — Apply NHSN and Local Surveillance Criteria
Bugsy surfaces supporting evidence, yet the infection preventionist still determines whether a case meets the required surveillance definition. This distinction matters, since the system assembles candidates rather than confirming infections outright.
Meanwhile, the CDC explicitly instructs infection preventionists to use HAI checklists together with the full NHSN Patient Safety Manual, rather than as standalone rules. Criteria review typically involves:
- Matching lab and clinical evidence against NHSN definitions
- Cross-checking device timing against infection windows
- Applying facility-specific local criteria where they extend NHSN rules
- Documenting which criteria were met and which were not
Intellivon’s approach: We build criteria-reference tools directly into the Bugsy review screen, so preventionists can check NHSN language against a candidate case without switching to a separate manual mid-review. Therefore, review time drops without cutting any step out of the process.
Once criteria are applied, the preventionist still needs the full clinical picture, which is what patient timeline investigation provides next.
Step 4 — Investigate the Patient Timeline
Timeline investigation pulls together every relevant clinical event around the candidate signal. Ultimately, this step is where a preventionist rules competing explanations in or out before committing to a classification.
The review typically spans:
- Symptom onset and progression
- All relevant culture and lab results
- Procedures performed near the signal date
- Device placement and removal timing
- Medication and antimicrobial history
- Unit and location history
- Prior infection episodes
- Other plausible infection sources
Intellivon’s approach: We surface timeline data in a single chronological view pulled from ADT, Beaker, and ClinDoc, rather than requiring preventionists to reconstruct the sequence manually across separate Epic screens. Consequently, investigation time shortens without sacrificing the depth NHSN review demands.
Once the timeline supports a determination, the case moves into formal documentation.
Step 5 — Document the Infection Case
Documentation converts a reviewed candidate into a formal, defensible infection record. At this point, every supporting decision from the previous steps gets recorded against the case.
Core documentation fields include:
- Infection classification
- Organism identification
- Event date
- Location and unit
- Device association, if applicable
- Supporting evidence summary
- Preventionist notes
Intellivon’s approach: We structure documentation templates around audit requirements first, so a case built today still holds up under a regulatory review conducted months later. As a result, documentation becomes a byproduct of the review process rather than a separate task.
Once documented, a case frequently triggers action beyond the infection-control team itself.
Step 6 — Trigger Operational Follow-Up
Certain classifications automatically or manually trigger downstream operational responses. Because infection control rarely operates in isolation, this step connects the case to the teams positioned to act on it.
Common follow-up actions include:
- Isolation status review
- Antimicrobial stewardship referral
- Exposure investigation for potential outbreak links
- Quality team escalation
Intellivon’s approach: We configure follow-up triggers so that stewardship and quality teams receive cases automatically rather than waiting on a manual handoff, which otherwise adds delay at the exact point speed matters most.
Finally, once follow-up actions are underway, the case reaches closure and reporting.
Step 7 — Close, Report and Analyze the Case
A closed case becomes part of the organization’s broader infection-control data set. Ultimately, this final step is what turns individual case review into system-wide visibility.
Closed cases typically contribute to:
- HAI reporting
- NHSN submission
- Quality metric calculations
- Trend and cluster analysis
- Leadership dashboards
Intellivon’s approach: We connect closed-case data directly to Clarity and Caboodle reporting structures at build time, so trend analysis and NHSN submission draw from the same validated case data instead of a separate export process.
Each of these seven steps builds directly on the one before it, moving a raw data signal through preventionist judgment and into a reportable, audit-ready case. Because NHSN criteria and clinical timeline review sit at the center of this process, the platform assists surveillance rather than replacing it.
That distinction matters even more once regulatory reporting requirements enter the picture, which the next section covers directly.
Which Epic Bugsy Analytics Matter to Infection Control Leaders
Different roles need different views of the same infection data, so a single dashboard rarely serves everyone. Instead, Bugsy’s reporting spreads across role-specific dashboards, each built around one audience’s actual decision.
1. Infection Preventionist Surveillance Dashboard
This dashboard gives IP staff a live, operational view of active work rather than a historical report. As a result, it functions as the daily worklist that drives case review.
- New candidate signals awaiting triage
- Pending investigations in progress
- Positive organism results requiring follow-up
- Current isolation status by patient
- Open, unclosed case count
2. HAI Rate Dashboard
The HAI rate dashboard tracks device-associated and procedure-associated infection rates across units. Consequently, it becomes the primary view leadership checks before a quality or accreditation review.
- CLABSI rates by unit
- CAUTI rates by unit
- SSI rates by procedure type
- Device days as the rate denominator
- Unit-level trend lines over time
3. Standardized Infection Ratio Dashboard
SIR compares an organization’s observed infections against a predicted number based on national baseline data. Therefore, a raw infection count, an infection rate, and a SIR are three different measures, not interchangeable terms.
A raw count simply totals infections. A rate divides that count by device days or patient days. SIR then adjusts that rate against a risk-standardized national benchmark, which is the figure CMS and NHSN actually use for comparison across facilities.
4. Antimicrobial Use and SAAR Dashboard
This dashboard ties directly into stewardship, tracking how antimicrobials get prescribed relative to expected use.
Specifically, the Standardized Antimicrobial Administration Ratio compares actual antimicrobial days of therapy against a predicted benchmark, similar in structure to SIR but scoped to drug utilization instead of infections.
5. Pathogen and Resistance Dashboard
Resistance patterns shift by unit and by season, so this dashboard tracks organism and antibiotic data across several dimensions at once.
- Organism identification
- Antibiotic susceptibility results
- Unit-level resistance patterns
- Facility-wide trends
- Specimen source
- Time-based resistance shifts
6. When Bugsy Reporting Should Move Into Clarity or Caboodle
Bugsy and Radar handle operational IP workflow well, but they are not built for deep historical analysis or cross-system reporting. Once a question moves past daily operations, the right tool changes.
- Bugsy and Radar: operational IP workflow and live case tracking
- Clarity: detailed, record-level historical SQL reporting
- Caboodle: enterprise data warehouse for standardized, dimensional analytics
- SlicerDicer: self-service cohort exploration without SQL
- External BI tools: cross-system leadership analytics spanning infection, financial, and operational data
For a deeper breakdown of historical SQL reporting, see our guide on Epic Clarity vs Caboodle breakdown. For self-service cohort exploration without writing SQL, see our guide on Epic SlicerDicer.
Bugsy’s dashboards split cleanly by audience, from daily IP worklists to board-level KPIs, with SIR and SAAR sitting at the center of most leadership conversations.
Once reporting needs outgrow Bugsy’s operational scope, Clarity, Caboodle, and SlicerDicer pick up the deeper analytical work. That handoff point matters directly for the regulatory reporting requirements covered next.
How to Plan an Epic Bugsy Implementation Without Surveillance Gaps
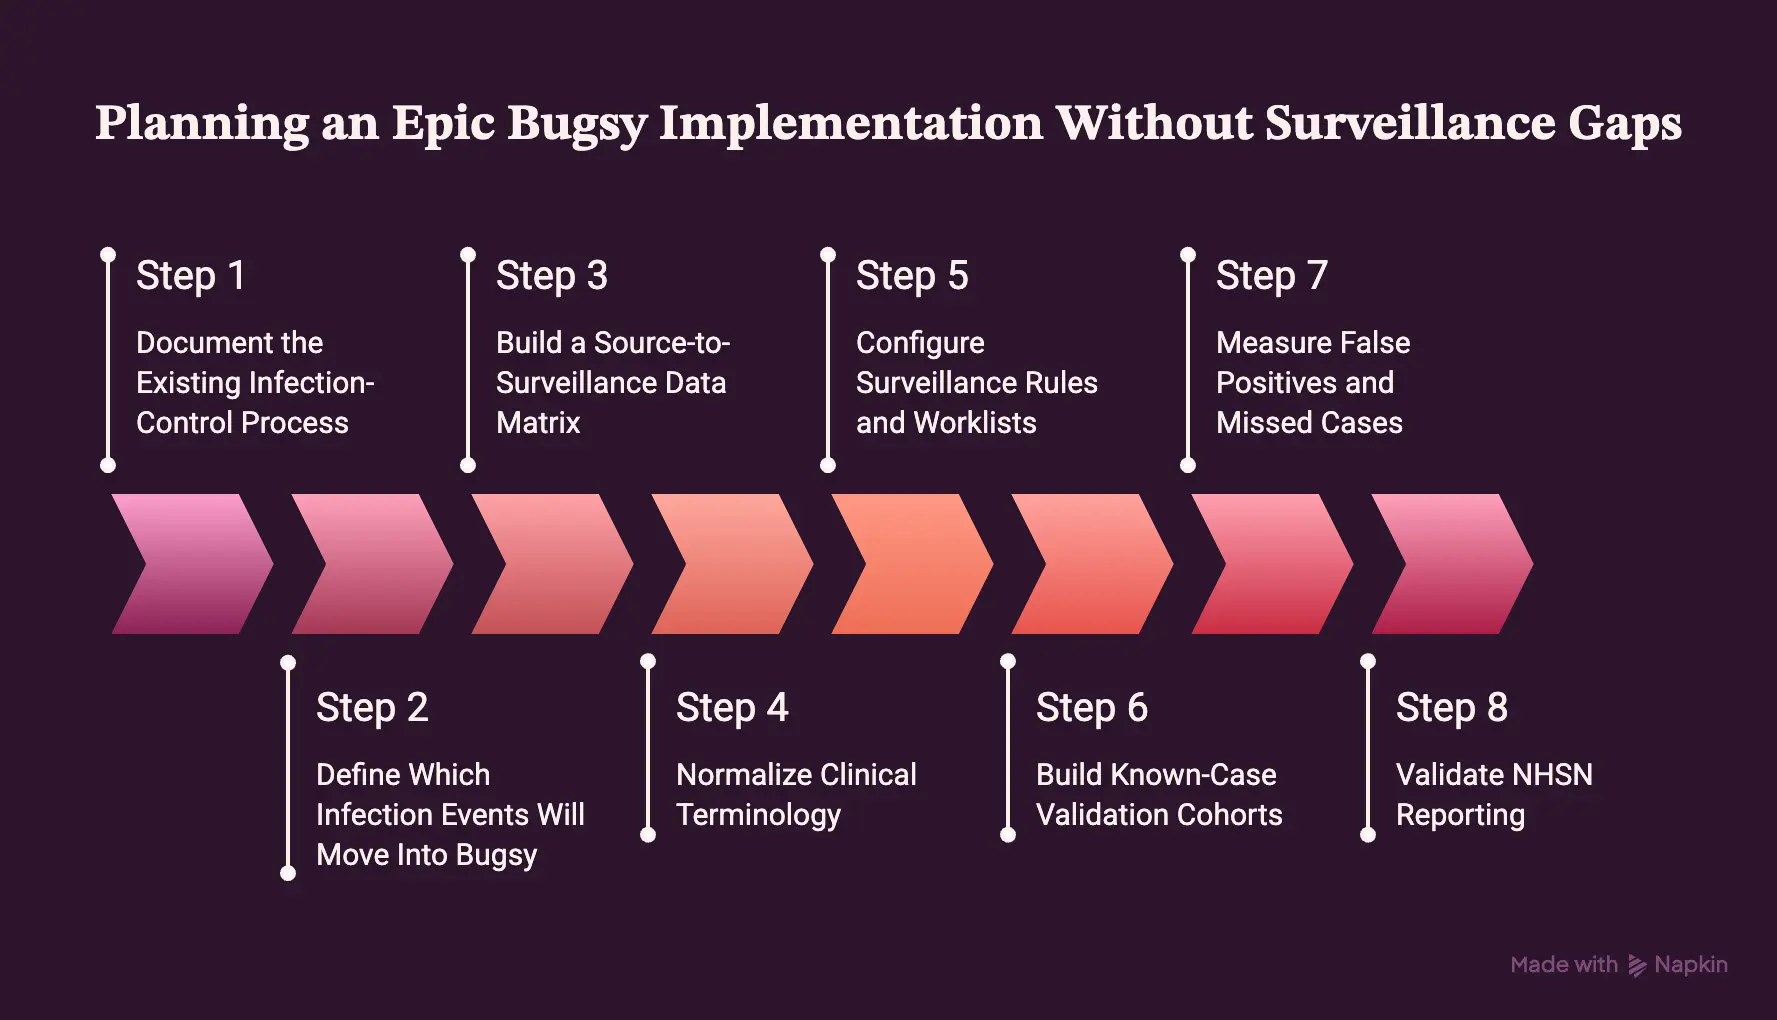
A Bugsy implementation succeeds or fails based on planning decisions made before configuration ever starts. Consequently, this section walks through eight sequential steps that close surveillance gaps before go-live rather than discovering them afterward.
Step 1: Document the Existing Infection-Control Process
Documenting the current process means cataloging every surveillance activity, tool, and workaround already in use. Otherwise, teams risk rebuilding gaps that already existed in the manual process.
A full inventory typically covers:
- Current surveillance methods and criteria in use
- Active and historical case volumes
- Existing reports and their recipients
- Third-party surveillance tools still running
- Manual processes staff rely on
- Spreadsheets used to track anything Epic doesn’t
Intellivon’s approach: We run this inventory as a structured interview process with infection-control staff directly, since undocumented workarounds rarely appear in existing policy documents but drive most of the day-to-day workflow.
Once the current state is documented, scope decisions become far easier to make.
Step 2: Define Which Infection Events Will Move Into Bugsy
Scope definition determines which infection categories Bugsy will actively surveil from day one. Without this step, teams either over-scope the build or leave critical event types uncovered.
Typical scope categories include:
- CLABSI
- CAUTI
- SSI
- LabID events
- VAE
- MDRO
- AUR
- Facility-specific local rules
Intellivon’s approach: We scope event types against actual infection volume and regulatory obligation first, rather than defaulting to every available Bugsy module, since unused modules still carry configuration and maintenance overhead.
With scope defined, the next step maps exactly where each event’s supporting data comes from.
Step 3: Build a Source-to-Surveillance Data Matrix
A source-to-surveillance matrix maps each surveillance requirement to its exact data origin inside Epic.
This single artifact prevents the most common implementation failure: a surveillance rule that fires without the data it actually needs.
| Surveillance Requirement | Required Source |
| Organism identification | Microbiology (Beaker) |
| Patient location | ADT |
| Device presence | Central line / LDA documentation |
| Antibiotic therapy | Pharmacy |
| Surgical procedure | OR / procedure data |
| Isolation status | Orders/documentation |
Intellivon’s approach: We build this matrix before any rule configuration begins, since gaps identified here cost hours to fix, while the same gaps discovered post-go-live cost weeks of manual correction.
Once every source is mapped, the underlying terminology itself needs standardizing.
Step 4: Normalize Clinical Terminology
Terminology normalization ensures lab and clinical data speak a consistent language across every source system feeding Bugsy. Otherwise, matching logic misses cases simply because two systems labeled the same organism differently.
Normalization typically addresses:
- LOINC codes for lab results
- SNOMED CT for clinical terms
- Local, facility-specific codes
- Organism dictionary standardization
- Antimicrobial dictionary standardization
Intellivon’s approach: We reconcile local code sets against LOINC and SNOMED CT mappings during build, rather than assuming Epic’s default dictionaries already match a facility’s historical lab conventions.
With terminology aligned, surveillance rules and worklists can then be configured accurately.
Step 5: Configure Surveillance Rules and Worklists
Rule and worklist configuration translates the scoped event types into working surveillance logic. Because these rules directly drive daily IP workload, infection preventionists need to be involved directly, not consulted after the fact.
Intellivon’s approach: We run configuration sessions with infection preventionists in the room, since rule thresholds that look correct on paper often generate unworkable alert volume once real clinical variation enters the system.
Configured rules then need to prove accurate against known cases before they go live.
Step 6: Build Known-Case Validation Cohorts
Validation cohorts test configured rules against cases with already-known outcomes. This step catches logic errors before they reach live surveillance queues.
Effective cohorts include:
- Confirmed infection cases
- Confirmed non-infection cases
- Borderline or ambiguous cases
- Patient transfer cases
- Multiple-device cases
- Cases with corrected lab results
Intellivon’s approach: We build validation cohorts from each facility’s own historical case data rather than generic test scenarios, so validation reflects the actual clinical complexity the live system will face.
Validation cohorts then feed directly into formal accuracy measurement.
Step 7: Measure False Positives and Missed Cases
Accuracy measurement quantifies how often Bugsy’s rules generate incorrect signals in either direction. This step was historically under-emphasized in most implementations, yet it determines whether IP staff trust the system at all.
Measurement typically covers:
- Sensitivity against known cases
- Specificity where clinically meaningful
- False-positive workload generated per rule
- Missed-event review against confirmed cases
Intellivon’s approach: We track false-positive rate per rule during validation, then tune thresholds before go-live, since a rule generating excessive noise gets ignored by staff regardless of how clinically sound its logic is.
Once accuracy holds steady, formal regulatory validation closes out the implementation.
Step 8: Validate NHSN Reporting
NHSN validation confirms that closed cases and AUR data submit correctly and match expected formats before relying on the system for regulatory reporting.
The CDC’s 2026 training curriculum specifically includes HAI validation and AUR data-quality modules, which signals that validation now sits inside core implementation work rather than functioning as optional post-launch testing.
Intellivon’s approach: We run parallel NHSN submissions against manually validated case data for at least one full reporting cycle before cutting over completely, so any formatting or logic gap surfaces before it affects an actual regulatory submission.
These eight steps move an implementation from process documentation through terminology normalization, rule validation, and finally regulatory testing, closing surveillance gaps at each stage rather than discovering them in production.
Because validation and false-positive measurement anchor steps seven and eight, they directly shape whether the cost and timeline discussed next hold up in practice.
How AI Can Extend Epic Bugsy Without Making Infection Calls Alone
AI adds real value to Bugsy by prioritizing, surfacing, and flagging, never by making the final infection determination itself. Consequently, every use case below extends human judgment rather than replacing it.
1. Prioritize Surveillance Queues
Prioritization models rank candidate cases by likelihood and urgency, so preventionists review the highest-risk cases first. Even so, the human reviewer still confirms every infection, since ranking logic only reorders a queue rather than closing a case.
- Risk-based ranking of open candidates
- Urgency flags for time-sensitive device-associated cases
- Workload balancing across preventionist assignments
Once queues are prioritized, the next opportunity, therefore, is finding patterns across cases that no single review would otherwise catch.
2. Find Infection Clusters Across Large Data Sets
Cluster detection models scan across far more variables simultaneously than manual review realistically allows. As a result, patterns that would otherwise take days to spot manually surface within hours instead.
Specifically, models can correlate across:
- Unit and location
- Organism identity
- Time windows
- Resistance patterns
- Shared procedures
- Device type
- Patient movement history
Even so, a statistical cluster still requires epidemiological judgment before anyone declares an actual outbreak. Beyond structured data, meanwhile, clinical notes hold evidence that structured fields alone miss entirely.
3. Use NLP to Surface Evidence From Clinical Notes
NLP extraction pulls relevant clinical detail from free-text notes that structured data fields never capture. As a result, preventionists get a fuller evidence picture without reading every note manually.
Typically, extraction targets:
- Documented symptoms
- Infection indicators mentioned in narrative notes
- Procedure details not captured in structured fields
- Antibiotic indication and rationale
- Relevant patient history
Since narrative notes vary widely in language and structure, this extraction works best as a supplement to structured review, rather than a replacement for it. However, data quality issues can undermine every use case above, which makes detecting them a distinct priority.
4. Detect Surveillance Data Problems
Data-quality monitoring may be the single strongest AI use case inside Bugsy, since a broken feed silently invalidates every downstream surveillance rule. Consequently, catching these problems early prevents weeks of undetected surveillance gaps.
Accordingly, models can flag:
- Missing result feeds
- Sudden, unexplained volume changes
- Unrecognized or unmapped organisms
- Terminology mapping failures
- Interface latency issues
- Unexpected zero counts on active rules
Because a silent data gap looks identical to genuinely low infection activity, automated monitoring closes a blind spot that manual review rarely catches in time. With data integrity monitored, in turn, forecasting shifts attention toward future operational demand.
5. Forecast Operational Infection-Control Demand
Forecasting models project infection-control workload ahead of time, based on historical trend data. As a result, teams can staff and plan around predictable demand rather than reacting after volume spikes.
Generally, forecasts cover:
- Expected isolation volume
- Stewardship review workload
- Unit-level infection trend projections
These projections support staffing and budget planning, yet they remain estimates rather than guarantees, since infection patterns shift with seasonal and outbreak-driven variability. Ultimately, that same distinction between prediction and determination applies just as strongly to every AI use case in this section.
Why AI Should Not Independently Determine NHSN Events
AI prioritizes and surfaces evidence. Infection-prevention professionals, however, make reportable-event determinations. This distinction is the correct division of responsibility given what NHSN reporting actually requires.
Overall, AI strengthens Bugsy through prioritization, cluster detection, NLP extraction, data-quality monitoring, and workload forecasting, while infection-prevention professionals retain every reportable-event determination.
That boundary, in turn, keeps AI positioned as infrastructure supporting clinical judgment, not a replacement for it, which matters directly for the regulatory and compliance requirements covered next.
What Custom Epic Bugsy Integration and Optimization Costs
Custom integration, analytics, automation, and AI development around an existing Epic Bugsy environment generally costs $70,000–$300,000, excluding Epic licensing and Epic implementation fees.
This range covers engineering work built around Bugsy, not the platform itself, since Intellivon does not sell or license Bugsy directly.
Custom Epic Bugsy Integration and Optimization Cost Table
| Workstream | Typical Planning Range |
| Discovery and surveillance mapping | $8,000–$20,000 |
| Data architecture and terminology mapping | $10,000–$30,000 |
| LIS/Beaker/HL7/FHIR integrations | $20,000–$70,000 |
| Workflow and automation extensions | $15,000–$50,000 |
| Analytics and dashboard engineering | $15,000–$60,000 |
| Security, testing and validation | $10,000–$35,000 |
| Training and production rollout | $8,000–$25,000 |
| Optional AI/NLP layer | $20,000–$60,000 |
These are planning ranges for custom surrounding engineering, and not Epic pricing.
1. What Keeps a Project Near $70,000
A single hospital, an existing Bugsy build, clean microbiology data, few external integrations, and limited dashboard scope all reduce cost.
2. What Pushes a Project Toward $300,000
IDN scope, multiple hospitals, an external LIS, legacy surveillance replacement, complex data mapping, AUR requirements, enterprise analytics, AI, and overlapping reporting requirements all add cost.
3. Ongoing Maintenance Costs
Maintenance typically runs 15%–25% of the initial build annually, covering interfaces, Epic upgrades, NHSN updates, terminology, dashboards, AI monitoring, and regression testing.
Scope, not Bugsy itself, drives cost between $70,000 and $300,000. A scoping exercise upfront turns that range into an accurate number.
How Intellivon Extends Epic Bugsy Around Existing Workflows
If your organization already runs Epic Bugsy, the harder question usually is not whether surveillance data belongs inside the platform. Instead, it is deciding which workflows should stay native to Bugsy and which need custom engineering built around it.
That is the scoping work Intellivon does directly, covering:
- Source-to-surveillance data mapping across microbiology, ADT, device, and pharmacy feeds
- LIS, Beaker, HL7, and FHIR integration for organizations running mixed systems
- Terminology normalization across LOINC, SNOMED CT, and local code sets
- Analytics and dashboard engineering across Radar, Clarity, Caboodle, and external BI tools
- Validation and false-positive tuning ahead of NHSN reporting
- AI extensions for prioritization, cluster detection, and data-quality monitoring
- Security, audit, and HIPAA-aligned governance across every integration point
Because each of these decisions depends on your existing Epic build and current surveillance maturity, a scoping conversation is usually the fastest way to get clarity, rather than estimating cost or timeline in advance.
Conclusion
Ultimately, Epic Bugsy works best as a workflow layer over data already moving through Epic, and not a standalone infection-detection system. Consequently, its value depends on clean source data, well-configured surveillance rules, and preventionists who still own every reportable determination.
Therefore, organizations evaluating Bugsy need clarity on integration scope, validation requirements, and cost before committing. As covered throughout this guide, that clarity typically comes from a focused scoping exercise, not a generic estimate, which is exactly where a technical partner like Intellivon adds the most value.
FAQs
Q1. What Is Epic Bugsy Used For?
A1. Epic Bugsy is used for infection surveillance, case investigation, isolation tracking, antimicrobial stewardship support, and NHSN regulatory reporting. Essentially, it helps infection-prevention teams identify possible infections, document confirmed cases, and report standardized metrics, all within one Epic-native workflow rather than across separate systems.
Q2. Does Epic Bugsy Require Epic Beaker?
A2. No, Bugsy does not universally require Beaker. However, it does need structured microbiology data to function accurately. Beaker provides the native Epic path for that data, while organizations running other lab systems instead require custom interfaces and terminology mapping to achieve equivalent results.
Q3. Can Epic Bugsy Automatically Detect CLABSI and CAUTI?
A3. Not entirely on its own. Bugsy can identify possible CLABSI and CAUTI events using available microbiology, device, and ADT data combined with configured logic. Still, infection-prevention professionals must apply NHSN surveillance definitions and validate each case before it counts as confirmed.
Q4. Can Epic Bugsy Submit Data to NHSN?
A4. Yes, Bugsy supports NHSN submission workflows once cases are documented and closed. That said, submission accuracy depends entirely on upstream validation. Consequently, organizations still bear responsibility for confirming case data before it reaches NHSN, since the platform assists reporting rather than guaranteeing its accuracy.
Q5. Can Epic Bugsy Track Antibiotic Use and Resistance?
A5. Yes, with the right data feeds and configuration in place. In fact, Epic’s current certification specifically includes Bugsy Infection Control antimicrobial-use and resistance reporting, which means stewardship tracking is a supported, established capability rather than an edge-case workaround.
Q6. Should Hospitals Replace VigiLanz or Another Surveillance Tool With Bugsy?
A6. Rather than a simple yes or no, the decision depends on Epic maturity, existing tool investment, and integration complexity. Generally, Epic-native, single-EHR organizations benefit most from consolidating into Bugsy, while multi-EHR or heavily customized third-party environments may find replacement less immediately worthwhile.
Q7. Can Bugsy Work With an External LIS?
A7. Yes, provided the required microbiology data gets mapped and exchanged reliably through proper interfaces. Even so, external LIS environments typically demand more upfront integration and terminology-mapping work than Epic-native Beaker environments, which directly affects both implementation timeline and cost.