Key Takeaways:
-
The Epic Clarity system stores Epic data in a relational database that allows healthcare teams to produce detailed historical reports covering clinical, operational, and research data.
-
It is primarily employed for SQL reporting and for more in-depth analysis, such as that concerned with quality measures, patient cohorts, revenue cycle reporting, and clinical research.
-
Clarity is not suitable for all reporting requirements, and when teams need different data speeds or workflows, they can use Caboodle, SlicerDicer, Reporting Workbench, FHIR, or HL7.
-
The cost of Custom Clarity work usually ranges from $70,000 to $300,000, the amount depending on the reporting scope, the BI setup, the integrations, the data engineering, and the AI requirements.
-
Intellivon supports Epic Clarity by providing reporting, business intelligence, integration, cloud, and AI solutions around Epic without altering Epic’s core system.
In the majority of healthcare analytics teams, requests for reports accumulate rapidly, and a single query can stay in the queue for as long as weeks before anyone looks at it. Epic Clarity was created in order to cut down on that kind of delay, wherein it is Epic’s reporting database and provides analysts with direct SQL access to clinical, operational, and financial data instead of asking each question to go through one overloaded team.
Just giving analysts a login does not by itself get rid of the backlog. This is because if there is no data model that has actually been designed for reporting, each new request has to start with a new query, and the teams are then obliged to choose between Clarity, Caboodle, and external tools such as Power BI or Tableau without any clear guidance to tell them which tool should be used in each situation.
Clarity-based reporting environments have been set up for health systems that have to make decisions of this kind. The difficulties that occur are generally found to stem from the data model and the governance layer, not at all from the database engine.
This is the reason why this blog looks at Clarity’s architecture, its data model, how it compares with Caboodle, third-party BI integration, HIPAA compliance, and what a properly configured system actually looks like when it goes live.

What Is Epic Clarity and Where Does It Fit in Epic Analytics?
Epic Clarity is Epic’s relational reporting database, built to hold data extracted from the live EHR so analysts can query it with standard SQL. In other words, it is not the transactional system clinicians use, and it is not a dashboard tool on its own.
So, what exactly does Clarity do inside the Epic ecosystem? Here’s the breakdown:
- Relational reporting database: Clarity stores Epic data in SQL-queryable tables, unlike the proprietary format Chronicles uses.
- Receives data from the live environment: Specifically, records originate in Chronicles, Epic’s transactional database, as care happens.
- Queried through SQL: As a result, analysts write SQL against Clarity tables to build reports, rather than pulling from the clinical interface directly.
- Supports five reporting domains: Because of this shared foundation, clinical, financial, quality, operational, and research reporting all run off the same Clarity tables.
- Not the live EHR: Instead, Clarity is a separate, read-optimized copy, so queries never touch active patient care systems.
- Not an end-user dashboard: Rather, Clarity is the data layer beneath dashboards, not a finished visualization tool on its own.
- Not Caboodle or SlicerDicer: Meanwhile, those are separate Epic products built on different data models for different use cases, which we’ll cover later in this guide.
Epic Clarity Explained in Simple Terms
Overall, data follows one direction: patient care generates records in Chronicles, and those records then move into Clarity for analysis.
To illustrate, here’s how that flow actually works:
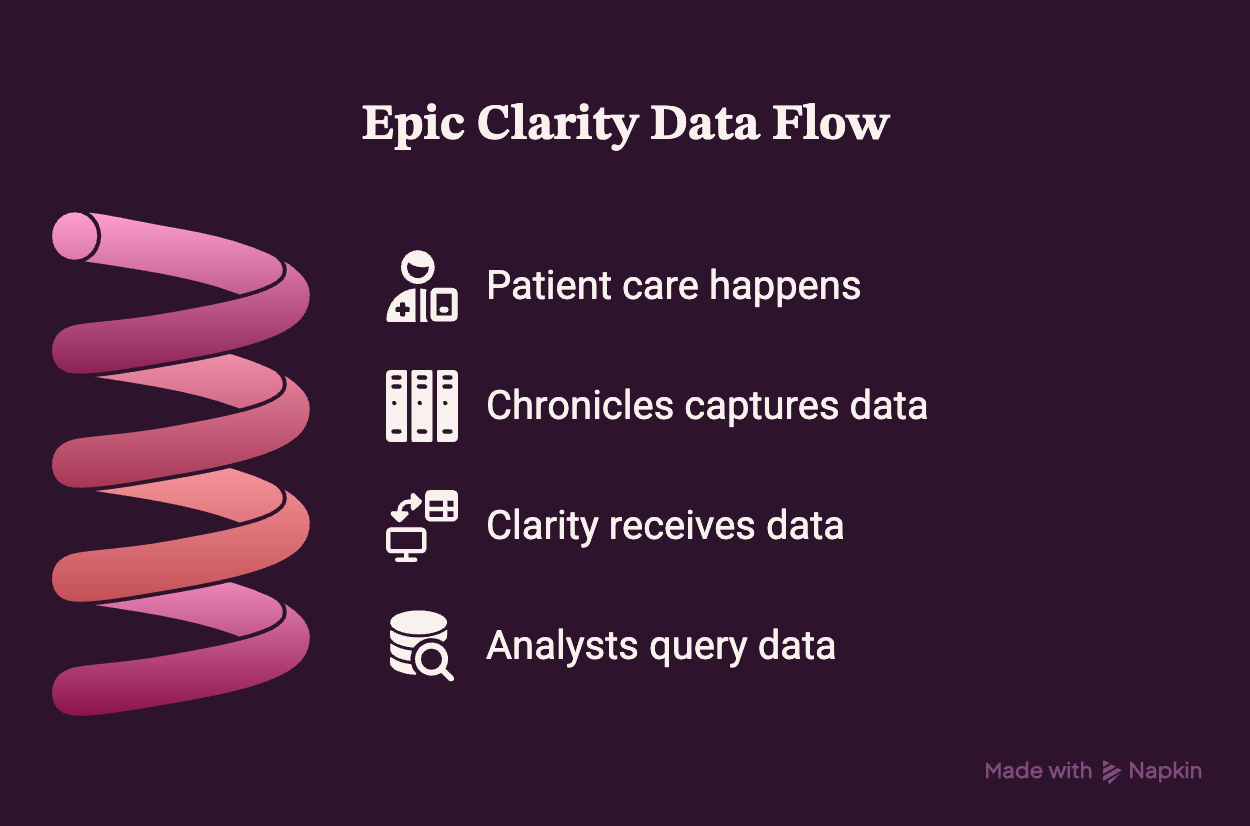
- Step 1 — Patient care happens: First, a clinician documents an order, result, or note inside Epic’s live system.
- Step 2 — Chronicles captures it: Immediately after, that data lands in Chronicles, Epic’s high-performance transactional database.
- Step 3 — Clarity receives it: Subsequently, through a scheduled extraction process, the data moves into Clarity’s relational tables.
- Step 4 — Analysts query it: From there, SQL-fluent teams pull, join, and report on that data without touching the live system.
- A caveat worth flagging: However, Epic itself describes Clarity’s SQL as customer-specific and often more complex than its standardized Kit-model reports, since every organization’s build differs.
Ultimately, Clarity is the SQL-queryable backbone that sits between patient care and your reports, not the EHR and not a dashboard. Because of this distinction, reporting teams avoid misusing tools built for different jobs.
Why Epic Clarity Still Matters for Healthcare Analytics in 2026
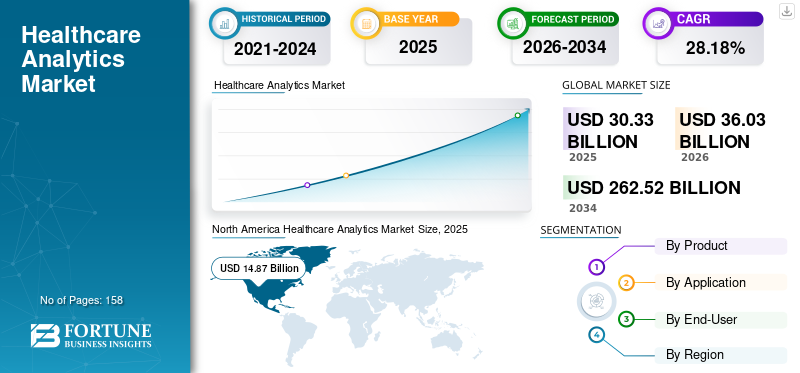
The global healthcare analytics market will reach $36.03 billion in 2026, growing at a rapid 28.18% CAGR. Consequently, Epic Clarity serves as the vital data layer for health systems modernizing their reporting infrastructure.
While transactional systems capture point-of-care workflows, Clarity extracts and normalizes this clinical record for downstream artificial intelligence, population health tracking, and cloud business intelligence.
1. Clarity Is Becoming a Source Layer for External Analytics
Epic Clarity transforms daily hospital records into structured relational tables. As a result, it operates as the primary ingestion foundation for modern enterprise data platforms.
First, health systems sync these records directly into cloud engines like Snowflake and Databricks. Next, clinical teams connect Power BI and Tableau to feed predictive analytics models for real-world research.
Therefore, modernizing this extraction workflow turns historical hospital data into reliable inputs for production AI.
2. Epic Kit and Clarity Now Serve Different Developer Needs
Epic Kit offers a standardized reporting model, whereas Clarity delivers the complete relational schema needed for advanced analytics.
For instance, open. Epic specifications highlight that Kit accelerates common application deployment across health systems. However, Clarity captures deeper historical data and custom hospital workflows that require specialized SQL engineering.
Ultimately, choosing the right data layer protects system uptime and accelerates enterprise decision-making.
Epic Clarity vs Caboodle, Chronicles, and Other Epic Tools
Epic Clarity is one layer inside a larger analytics ecosystem, not a standalone product. Specifically, Epic groups Chronicles, Reporting Workbench, Clarity, Caboodle, SlicerDicer, Radar, and Kit under its Cogito analytics umbrella (Source: UC Davis Health IT documentation). So, how do these layers differ?
- Chronicles: Naturally, this runs the live EHR and handles current transactional workflows.
- Clarity: Meanwhile, this provides detailed, record-level SQL reporting for audit-ready work.
- Caboodle: By contrast, this serves as the enterprise warehouse for standardized analytics.
- Reporting Workbench: Instead, this pulls current operational lists directly from Chronicles.
- SlicerDicer: Alternatively, this enables self-service cohort exploration without SQL.
- Radar: Similarly, this displays KPI dashboards for leadership.
- Kit: Finally, this offers standardized SQL views for faster developer access.
1. Chronicles, Clarity, and Caboodle — The Core Distinction
Chronicles records what’s happening live. After that, Clarity makes that data usable for deep, record-level reporting.
Consequently, Clarity supports audit-ready reports, regulatory measures like HEDIS and MIPS, revenue cycle investigations, and custom research extraction.
Epic Caboodle, on the other hand, handles enterprise-wide, dimensional analytics rather than granular detail, so it and Clarity solve different problems entirely.
2. Reporting Workbench, SlicerDicer, and Radar — Operational and Visual Layers
Because Reporting Workbench queries Chronicles directly, it works with more current data than Clarity’s extracted tables, making it ideal for discharge lists and open tasks.
Epic SlicerDicer, in contrast, gives non-SQL users self-service cohort and quality exploration.
Radar, meanwhile, is presentation-only, surfacing KPIs rather than storing data.
3. Epic Kit — Standardized SQL for Developers
Unlike Clarity, which often needs customer-specific SQL, Kit offers standardized views and stored procedures built for cross-organization consistency.
4. Which Epic Layer Fits Your Reporting Need
| Requirement | Best-Fit Epic Layer |
| Live EHR transactions | Chronicles |
| Operational patient lists | Reporting Workbench |
| Detailed historical SQL | Clarity |
| Enterprise analytical warehouse | Caboodle |
| Self-service cohort exploration | SlicerDicer |
| Leadership KPI dashboards | Radar |
| Standardized developer SQL model | Kit |
| Cross-system BI | Power BI, Tableau, or custom layer |
Ultimately, each layer matches a different combination of freshness, complexity, and audience. The right question is not whether Clarity beats Caboodle or SlicerDicer. Instead, it is which layer fits the decision being made.
Which Epic Clarity Capabilities Matter for Enterprise Reporting?
Epic Clarity’s core value comes from seven specific capabilities that support enterprise-grade reporting. Together, these functions are what separate Clarity from presentation tools like Radar or exploration tools like SlicerDicer.
1. Detailed SQL Reporting
Clarity allows analysts to write direct SQL against relational tables instead of relying on pre-built views. As a result, teams can build reports with the exact logic their organization requires.
- Record-level detail: Query individual encounters, orders, and results directly.
- Custom logic: Apply organization-specific filters and joins that Epic’s standard reports don’t cover.
2. Longitudinal Historical Analysis
Clarity retains historical data over time, so analysts can track trends across months or years. Because of this, it supports readmission tracking, length-of-stay analysis, and outcome trending.
- Trend detection: Compare performance across multiple reporting periods.
- Historical benchmarking: Measure current outcomes against past baselines.
3. Clinical and Financial Data Access
Clarity houses both clinical and financial data inside the same relational structure. Consequently, analysts can connect clinical events directly to billing and revenue cycle outcomes.
- Clinical tables: Orders, results, diagnoses, and medications.
- Financial tables: Charges, claims, and payer information.
4. Custom Queries and Reusable Data Views
Analysts can build reusable SQL views once and apply them across multiple reports. Therefore, teams avoid rewriting the same logic repeatedly.
- Reusable views: Standardize commonly used joins and filters.
- Faster iteration: Reduce development time on future reports.
5. Data Dictionaries and Table Relationships
Clarity’s data dictionary documents table structures and relationships across the database. Without it, new analysts face a steep learning curve navigating hundreds of tables.
- Table documentation: Column definitions and relationships between tables.
- Faster onboarding: New reporting analysts ramp up more efficiently.
6. Scheduled Analytical Data Refresh
Clarity refreshes on a scheduled cycle, typically nightly, rather than in real time. Meanwhile, this keeps analytical workloads separate from live clinical performance.
- Nightly extraction: Data updates once per day in most builds.
- Performance protection: Live systems stay unaffected by heavy queries.
7. Downstream BI and Analytics Connectivity
Clarity connects to third-party BI tools through standard ODBC and JDBC drivers. Ultimately, this makes it the primary data source for Power BI, Tableau, and custom analytics layers.
- Standard connectivity: ODBC and JDBC support most BI platforms.
- Foundation layer: Clarity feeds downstream dashboards rather than replacing them.
These seven capabilities are what make Clarity a reporting database, rather than a dashboard or exploration tool.
Where Epic Clarity Delivers Value Across Healthcare Analytics
Epic Clarity’s real value shows up across six distinct reporting domains, each pulling from the same underlying data model. Because these domains often need the same tables filtered differently, Clarity handles all six without requiring separate systems.
1. Clinical Quality and Patient Outcomes
Clarity powers quality measure reporting that regulatory bodies and internal quality teams both rely on. Specifically, it supports HEDIS and MIPS measure calculation directly from clinical documentation.
- Regulatory measures: HEDIS and MIPS reporting pulled from structured clinical data.
- Outcome tracking: Readmission rates, mortality, and length of stay trended over time.
- Safety monitoring: Medication safety events and infection control indicators flagged for review.
2. Population Health and Care Gaps
The system identifies care gaps across chronic disease populations by connecting diagnosis, lab, and encounter data. As a result, population health teams can target outreach before conditions worsen.
- Chronic disease tracking: Diabetes, hypertension, cardiovascular disease, and oncology trending.
- Behavioral and preventive care: Behavioral health utilization and preventive care and immunization gaps.
- Equity reporting: SDOH data and health equity disparities across patient populations.
3. Hospital Operations and Patient Flow
Clarity supports operational reporting that keeps hospitals running efficiently day-to-day. Consequently, operations leaders use it to spot bottlenecks before they affect patient care.
- Scheduling analytics: Appointment scheduling, no-show rates, and utilization patterns.
- Flow and capacity: ED throughput, patient flow, and capacity reporting across departments.
- Surgical operations: OR utilization and perioperative analytics for surgical services.
4. Revenue Cycle and Financial Reporting
The platform connects clinical events directly to billing outcomes, giving revenue cycle teams a full financial picture. Therefore, denial patterns and reimbursement gaps become traceable back to specific charge capture points.
- Claims and denials: Claims reporting and denial analytics tied to specific encounters.
- Coding and billing: Coding accuracy, charge capture, and billing reporting.
- Payer analytics: Payer mix reporting and reimbursement trend analysis.
5. Workforce and Provider Analytics
Clarity also tracks staffing and provider performance data alongside clinical outcomes. Meanwhile, this lets leadership connect productivity metrics to quality and financial results in one query.
- Provider productivity: Physician productivity and provider analytics by department.
- Staffing patterns: Nursing analytics and workforce reporting across shifts.
6. Clinical Research and Real-World Evidence
Clarity extracts structured datasets for research teams building real-world evidence studies. Because the data is already relational, research reporting avoids manual chart abstraction for most study designs.
- Trial support: Clinical trial reporting pulled directly from structured Clarity tables.
- Evidence generation: Real-world evidence datasets built for external research partnerships.
These six domains show why Clarity functions as shared infrastructure rather than a single-purpose tool.
What Makes Epic Clarity Hard to Scale Across Health Systems?
Scaling Clarity across a large health system creates operational friction most single-department deployments never encounter. As reporting volume grows, so does the risk of slow queries, conflicting numbers, and ungoverned access to sensitive data.
1. Complex Tables Make SQL Development Slow
Clarity’s relational schema often requires many joins and detailed Epic workflow knowledge to query correctly. Consequently, a straightforward executive question can turn into a multi-day reporting request.
- Join complexity: Answering one question can require touching a dozen or more tables.
- Knowledge dependency: Analysts need Epic-specific workflow context, not just SQL skill.
2. Batch Refreshes Can Create Data Latency
Clarity is generally built for analytical reporting rather than minute-by-minute transactional needs. As a result, teams sometimes try to build operational dashboards on data that is already hours old.
- Refresh timing: Nightly extraction cycles leave gaps for same-day decisions.
- Mismatched use case: Real-time dashboards need Reporting Workbench, not Clarity.
3. One-Off Reports Create Conflicting Numbers
Finance calculates readmissions one way, quality calculates them another way, and population health uses a different denominator entirely. Therefore, leadership ends up with three separate “correct” numbers for the same metric.
- Definition drift: Teams build metrics independently without a shared standard.
- Governance gap: This is a data governance problem rather than an SQL problem.
4. Poor SQL Can Slow Large Reporting Workloads
Uncontrolled queries and poorly designed SQL are identified as real production risks in current Clarity deployment guides. Specifically, full-table scans and unnecessary joins slow shared reporting infrastructure for everyone.
- Common culprits: Full-table scans, unnecessary joins, and poorly filtered queries.
- Compounding issues: Repeated calculations and inefficient extracts add further strain.
5. Epic Upgrades Can Break Custom Reporting Logic
Hard-coded queries accumulate as technical debt with every Epic upgrade cycle. Without proper controls, reports silently break or return wrong numbers after a system update.
- Required safeguards: Dependency mapping and version control across custom reports.
- Validation steps: Regression testing and post-upgrade validation before go-live.
6. PHI Access Can Become Difficult to Govern
Clarity holds highly sensitive clinical information across hundreds of interconnected tables. Meanwhile, governance gets harder once that data moves into Power BI, Tableau, Snowflake, Databricks, AI models, or external applications.
- Expanding surface area: Every new connection point is another place PHI can leak.
- Access control needs: Role-based permissions must extend beyond Clarity itself.
7. External Data Creates Another Integration Problem
Enterprise reporting questions rarely stop at Epic’s own tables. Instead, hospitals increasingly need to combine Clarity with payer claims, CRM, financial systems, devices, registries, call-center data, and third-party clinical systems.
- Integration scope: Payer, financial, and device data all sit outside Epic natively.
- Added complexity: Each new source needs its own mapping and validation logic.
8. AI Models Cannot Safely Query Raw Clarity Tables
Giving an LLM unrestricted access to thousands of healthcare tables introduces risks no health system can absorb casually. Because Clarity’s schema is complex and context-dependent, ungoverned AI access creates real clinical and compliance exposure.
- Technical risks: Wrong joins, hallucinated columns, and non-deterministic SQL output.
- Clinical and compliance risks: PHI exposure and clinically misleading answers reaching decision-makers.
Scaling Clarity exposes governance, performance, and integration gaps that single-team deployments rarely surface. These same gaps are exactly where a governed, AI-ready reporting architecture becomes worth designing deliberately rather than retrofitting later.
Let us look at how we address and fix these challenges in the next section.
How Intellivon Addresses Common Epic Clarity Challenges
Our experts approach Clarity reporting problems as architecture decisions rather than one-off report requests.
Specifically, each challenge below maps to a governed, repeatable fix instead of another custom SQL patch layered on top of existing technical debt.
Epic Clarity Challenges Mapped to Intellivon’s Solutions Approach
| Epic Clarity Challenge | Enterprise Impact | Intellivon Approach |
| Complex schema | Slow report delivery | Governed SQL views and reusable data models |
| Metric inconsistency | Leadership distrust | Central metric and semantic definitions |
| Data latency | Wrong tool for live workflows | Route real-time needs to FHIR, HL7, or event layers |
| Slow queries | Reporting bottlenecks | Query analysis and reporting model optimization |
| Report sprawl | High maintenance cost | Report inventory and rationalization |
| Epic upgrades | Broken dependencies | Regression testing and dependency controls |
| PHI exposure | Compliance risk | RBAC, auditability, encryption, and least privilege |
| External datasets | Fragmented reporting | Governed integration and cloud pipelines |
| BI complexity | Duplicate business logic | Certified datasets and semantic models |
| AI over raw data | Incorrect results | Governed AI-ready data layer |
A real healthcare modernization case from Hakkoda illustrates why this framework matters in practice. There, replacing manual Epic Clarity and Caboodle ingestion with metadata-driven pipelines and automated validation improved data availability and analytics reliability across the organization’s reporting environment.
Each fix in this table addresses the root cause behind a Clarity challenge rather than the symptom leadership actually notices first.
However, governance built this way tends to hold up through Epic upgrades and scale, which matters most once BI tools and AI systems start querying the same data underneath.
How to Build AI Analytics Around Epic Clarity Safely
AI adds predictive and conversational capability on top of Clarity’s reporting layer, not a replacement for it.
Because Clarity already holds structured clinical and financial history, it becomes the foundation AI models train and query against, provided access stays governed.
1. Readmission and Patient Risk Prediction
Historical Clarity data trains models that flag high-risk patients before discharge. As a result, care teams can intervene earlier instead of reacting after a readmission occurs.
- Model inputs: Prior admissions, diagnoses, and length-of-stay history from Clarity tables.
- Clinical use: Risk scores feed discharge planning workflows directly.
2. Denial and Revenue Cycle Prediction
Claims and denial history in Clarity trains models that flag claims likely to be denied before submission. Consequently, revenue cycle teams can correct issues upfront rather than appealing after the fact.
- Prediction target: Claims with a high probability of denial based on past patterns.
- Financial impact: Fewer write-offs and faster reimbursement cycles.
3. Capacity and Patient Flow Forecasting
Scheduling and admission history from Clarity supports forecasting for ED and OR capacity. Therefore, operations leaders can staff and plan ahead of demand spikes rather than during them.
- Forecast inputs: Historical admission, discharge, and scheduling patterns.
- Operational use: Staffing and capacity decisions made days in advance.
4. Natural-Language Questions Over Governed Epic Data
Natural-language interfaces let non-technical users ask questions without writing SQL directly against Clarity. However, this only works safely when queries route through governed, validated datasets first.
- Access point: Plain-language questions translated into pre-approved query logic.
- Safety requirement: No direct, unrestricted access to raw Clarity tables.
5. Clinical NLP Plus Structured Clarity Data
Clinical NLP extracts insights from unstructured notes, then combines them with structured Clarity data for a fuller picture. Meanwhile, this pairing surfaces patterns neither structured data nor notes alone would reveal.
- Combined signal: Structured diagnoses paired with narrative context from notes.
- Use case: Richer risk models that structured data alone would miss.
6. Human Validation for High-Risk Analytics
High-risk predictions, including mortality or readmission risk, require clinical review before acting on them. Ultimately, AI output supports clinical judgment rather than replacing it in these decisions.
- Validation step: Clinical staff review model output before workflow action.
- Accountability: A named reviewer signs off on high-stakes predictions.
AI extends what Clarity already reports, provided every layer stays governed and validated. That governance question naturally leads into what this kind of build actually costs.
How to Secure and Govern Epic Clarity Across the Enterprise
Governing Clarity at enterprise scale requires controls beyond basic database security, since the real risk sits in how data gets used once it leaves Clarity.
A VP of analytics ultimately cares whether a number can be trusted, not just whether a query runs successfully.
1. Role-Based Data Access
Role-based access control limits what each user can query based on job function rather than blanket database permissions. As a result, a scheduling analyst never sees the same PHI scope a quality director does.
- Access tiers: Permissions scoped to department, role, and specific data sensitivity.
- Reduced exposure: Fewer users with broad access means smaller breach risk.
2. Minimum-Necessary PHI Access
Minimum-necessary access limits PHI exposure to only the fields a given report actually requires. Consequently, a financial report pulls billing data without exposing unrelated clinical notes.
- Field-level control: Reports access only the columns needed for their purpose.
- Compliance alignment: Matches HIPAA’s minimum-necessary standard directly.
3. Audit Logging and Monitoring
Audit logs record who accessed which data, when, and through what query. Therefore, unusual access patterns get flagged before they become compliance incidents.
- Access trail: Every query is logged with user, timestamp, and dataset accessed.
- Anomaly detection: Unusual volume or scope triggers review.
4. Data Lineage
Data lineage tracks a number’s path from Chronicles through Clarity to the final report. Because of this, a VP of analytics can trace any figure back to its exact source.
- Traceability: Every metric is mapped to its originating tables and transformations.
- Trust building: Leadership can verify a number instead of taking it on faith.
5. Certified Metric Definitions
Certified definitions lock down how core metrics like readmission rate get calculated across teams. Otherwise, finance, quality, and population health keep producing three different “correct” answers.
- Single source of truth: One approved calculation per metric, documented centrally.
- Cross-team consistency: Every dashboard references the same definition.
6. De-Identification for Research and AI
De-identification strips or masks direct identifiers before data reaches research teams or AI models. As a result, research and AI workflows can proceed without unnecessary PHI exposure.
- Masking methods: Removal or tokenization of names, MRNs, and direct identifiers.
- Use case fit: Required for most external research and AI training scenarios.
7. HIPAA Controls for Third-Party BI
HIPAA controls extend into every BI tool connected to Clarity, not just the database itself. Meanwhile, a Business Associate Agreement and encrypted connection are non-negotiable once data reaches Power BI or Tableau.
- BAA requirement: Any third-party tool touching PHI needs a signed agreement.
- Encryption in transit: Data moving to BI platforms stays encrypted end to end.
These seven controls are what let a large organization trust its own numbers at scale. That same trust becomes the foundation for what a governed Clarity build actually costs to implement.
How We Implement and Optimize Epic Clarity Reporting Step-by-Step
Intellivon runs Clarity implementation and optimization through eight sequential steps, moving from audit to monitored production.
Because each step builds directly on the last, nothing gets built on assumptions that later steps might overturn.
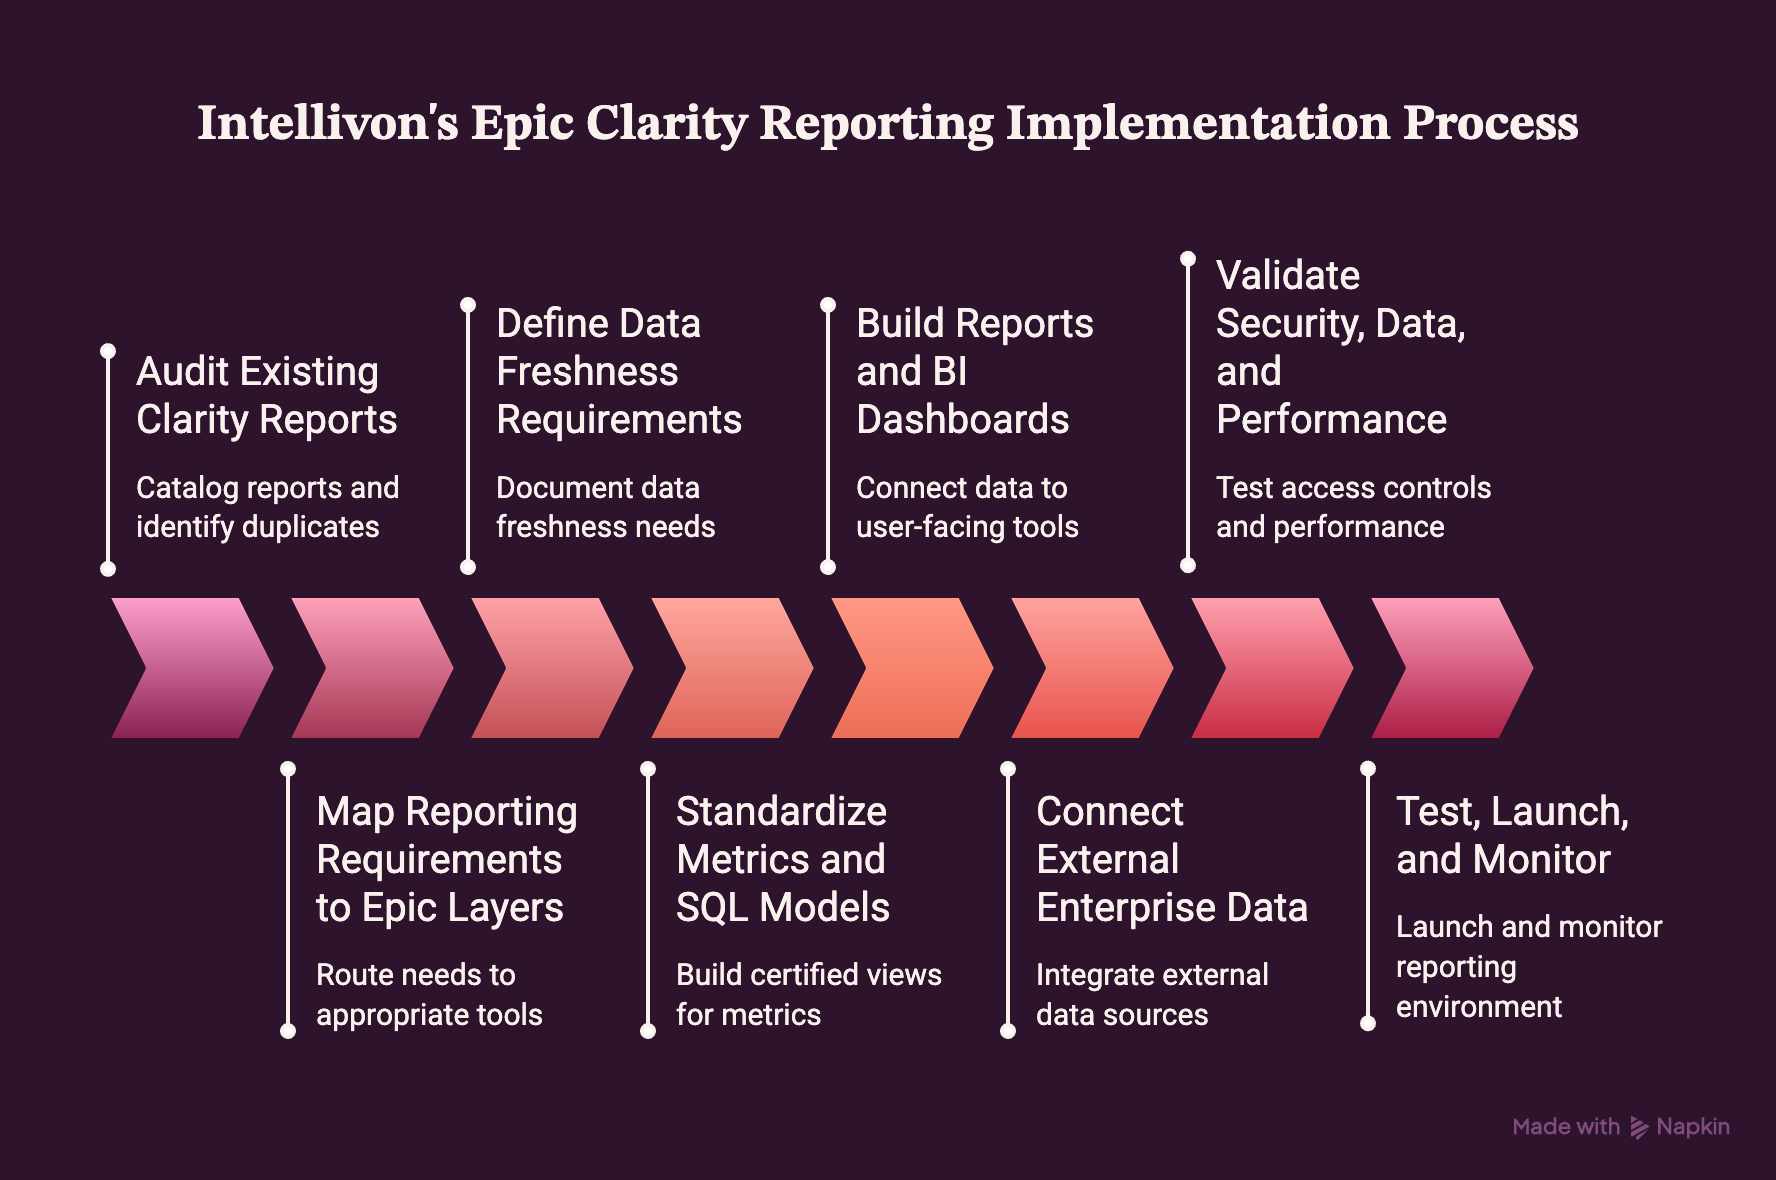
1. Audit Existing Clarity Reports
The first step catalogs every existing Clarity report, its owner, and its actual usage. As a result, duplicate and abandoned reports get flagged immediately, since they add maintenance cost without adding value.
Intellivon’s approach: We run a full report inventory before writing a single new query. Consequently, the build starts from what’s actually needed rather than what already exists.
2. Map Reporting Requirements to Epic Layers
This step routes each reporting need to Chronicles, Reporting Workbench, Clarity, or Caboodle based on freshness and complexity. Otherwise, forcing every request through Clarity creates unnecessary technical debt down the line.
Intellivon’s approach: We map each requirement against the decision table established earlier in this guide. That way, Clarity only carries the workload it’s actually built for.
3. Define Data Freshness Requirements
Freshness requirements determine whether nightly Clarity refreshes are sufficient or whether a workflow needs real-time data instead. In fact, getting this wrong is the single most common cause of failed operational dashboards.
Intellivon’s approach: We document freshness needs per use case upfront. From there, anything requiring live data gets routed to FHIR or event-based interfaces instead of Clarity.
4. Standardize Metrics and SQL Models
Standardized metric definitions and reusable SQL views replace the one-off queries that cause conflicting numbers across departments. Essentially, this step is where governance actually gets built into the reporting layer itself.
Intellivon’s approach: We build certified views around core metrics like readmission rate and denial rate. Therefore, every downstream report references the same calculation.
5. Build Reports and BI Dashboards
This step connects validated Clarity data to the reports and dashboards end users actually see, whether in Epic’s native tools or Power BI and Tableau. Notably, design decisions here determine adoption more than the underlying SQL does.
Intellivon’s approach: We build dashboards against the certified semantic layer from step four rather than raw Clarity tables. In this way, business logic stays in one place instead of scattered across dashboards.
6. Connect External Enterprise Data
External data, including payer claims, CRM records, and device data, gets integrated through governed pipelines rather than ad hoc extracts. Without this structure, enterprise reporting stays fragmented across disconnected systems.
Intellivon’s approach: We build integration pipelines with the same governance standards applied to Clarity itself. Ultimately, external data doesn’t become the weak link in an otherwise controlled system.
7. Validate Security, Data, and Performance
Validation confirms that access controls, data accuracy, and query performance all hold up before anything reaches production. Otherwise, skipping this step is how PHI exposure and slow dashboards make it past go-live.
Intellivon’s approach: We run RBAC testing, data reconciliation, and load testing as one combined validation pass. Rather than three separate afterthoughts, this happens as a single coordinated check.
8. Test, Launch, and Monitor
The final step launches the reporting environment with monitoring in place to catch performance or data issues early. Equally important, post-launch monitoring matters as much as the build itself, since Epic upgrades and usage growth both introduce new risk over time.
- Intellivon’s approach: We set up ongoing monitoring alongside a regression testing cadence tied to Epic’s upgrade schedule. As a result, reporting logic doesn’t quietly break after a system update.
Suggested Timelines by Project Scope
- Focused Clarity optimization: 8 to 12 weeks for report rationalization and query performance work.
- Enterprise BI program: 12 to 20 weeks for a full semantic layer and BI dashboard build.
- Cloud or AI analytics extension: 20 to 32 weeks for governed AI-ready data layers on top of Clarity.
Altogether, these eight steps move a Clarity environment from fragmented and report-heavy to governed and scalable.
Naturally, that timeline and scope raise the next question every VP of analytics asks before committing to a build, which is what this actually costs.
What Epic Clarity Optimization Costs: $70,000 to $300,000
Custom Epic Clarity reporting, data engineering, BI integration, analytics optimization, and AI extensions typically cost $70,000 to $300,000, excluding Epic licensing and core Epic infrastructure costs.
Because scope varies so much between a focused optimization project and a full enterprise BI build, the range below breaks down by workstream rather than a single flat number.
Epic Clarity Cost Breakdown by Workstream
| Workstream | Typical Investment |
| Discovery and reporting audit | $8K–$20K |
| Architecture and data modeling | $15K–$45K |
| SQL and analytics development | $20K–$70K |
| BI and dashboard engineering | $15K–$60K |
| Cloud and data integrations | $20K–$80K |
| AI analytics extensions | $25K–$100K |
| Security, UAT, and deployment | $12K–$40K |
| Typical engagement | $70K–$300K |
These workstreams represent overlapping scope components within a single engagement rather than costs that stack on top of each other.
In other words, a $150,000 project typically spans several rows at once rather than summing every row’s maximum.
What Drives Cost Towards $300,000
Several variables drive cost toward the higher or lower end of this range.
- Specifically, the number of existing reports needing rationalization, the number of BI tools requiring integration, and whether AI extensions are in scope all shift the final number.
- A focused query optimization project lands closer to $70,000, while a full enterprise build spanning Clarity, BI, external data, and AI readiness moves toward $300,000.
Ongoing Maintenance Cost
Ongoing maintenance typically runs 15% to 25% of the initial engineering cost annually.
This covers regression testing after Epic upgrades, metric governance upkeep, and continued performance tuning as reporting volume grows.
How Intellivon Extends Epic Clarity Without Modifying Epic
Intellivon builds governed reporting, integration, BI, cloud, and AI layers around Epic Clarity rather than changing Epic’s proprietary core.
This keeps your Epic build stable while extending what your reporting and analytics teams can actually do with the data underneath it.
- Clarity Reporting and SQL Optimization: We tune slow queries, rationalize report sprawl, and build reusable SQL models around your existing Clarity tables.
- Healthcare Data Engineering: We design ETL pipelines and data models that keep Clarity, Caboodle, and external sources consistent.
- Power BI and Enterprise Analytics: We build semantic layers that connect Clarity to Power BI, Tableau, or Qlik without duplicating business logic.
- Cloud Data Platform Integration: We move governed Clarity datasets into Snowflake, Databricks, or similar platforms for broader analytics.
- FHIR, HL7, and API Development: We route real-time needs through proper interfaces instead of forcing them through Clarity.
- Predictive and Generative AI Extensions: We layer AI on top of Clarity data through a governed, validated access path.
- Healthcare Data Governance and MLOps: We manage access control, model monitoring, and compliance as Clarity workloads scale.
Ready to build a governed reporting and analytics layer around Epic Clarity? Intellivon can help map your current reporting environment, identify the right architecture, and scope a build before development starts.
Conclusion
Ultimately, Epic Clarity is rarely the actual problem health systems face. Instead, the real challenge is deciding which questions belong in Clarity, which belong in Caboodle or native Epic tools, and which require enterprise BI or governed AI. Once that routing decision gets made correctly, Clarity performs exactly as designed.
Therefore, the organizations that scale analytics successfully are the ones that architect around Clarity rather than force everything through it.
FAQs
Q1. Is Epic Clarity a Database or Reporting Tool?
A1. Clarity is a relational database, not a finished reporting tool on its own. Specifically, it stores query-ready tables that analysts access through SQL. Reporting tools like Crystal Reports or Power BI then sit on top of Clarity to actually display the results.
Q2. Is Epic Clarity Real-Time?
A2. No, Clarity is not real-time. Instead, it refreshes on a scheduled cycle, typically nightly, through Epic’s ETL process. Because of this latency, workflows needing live data should use Reporting Workbench or FHIR interfaces rather than Clarity directly.
Q3. What Is the Difference Between Epic Clarity and Chronicles?
A3. Chronicles runs the live EHR and handles real-time clinical transactions. Clarity, on the other hand, is the extracted, relational copy built specifically for SQL-based analytical reporting. Therefore, Chronicles supports patient care, while Clarity supports analysis after the fact.
Q4. What Is the Difference Between Epic Clarity and Caboodle?
A4. Clarity provides detailed, record-level SQL reporting, while Caboodle serves as the enterprise data warehouse for standardized, dimensional analytics. As a result, Clarity fits granular investigations, whereas Caboodle fits broad, enterprise-wide KPI reporting across departments.
Q5. How Is SlicerDicer Different From Epic Clarity?
A5. SlicerDicer allows self-service cohort exploration without writing SQL, unlike Clarity, which requires SQL expertise. Consequently, SlicerDicer suits quick clinical and quality questions, while Clarity suits audit-ready, record-level reports requiring deeper technical control.
Q6. When Should Reporting Workbench Be Used Instead of Clarity?
A6. Reporting Workbench should be used when a workflow needs current, operational data, since it queries Chronicles directly. Meanwhile, Clarity fits historical, detailed analysis instead. Discharge lists and today’s appointments are Reporting Workbench use cases, not Clarity ones.
Q7. Can Epic Clarity Data Be Moved Into Snowflake or Databricks?
A7. Yes, Clarity data can move into Snowflake or Databricks through governed extraction pipelines. However, this requires careful mapping and validation, since raw Clarity tables are complex. Properly built pipelines keep cloud analytics consistent with source Clarity data.
Q8. Can Third-Party Developers Access the Epic Clarity Data Model?
A8. Yes, third-party developers can access Clarity through ODBC or JDBC connections, provided proper credentials and governance are in place. That said, access should always route through role-based controls, since Clarity contains highly sensitive PHI across its tables.