Key Takeaways
-
Epic SlicerDicer (an application inside the Epic EHR system) lets healthcare teams ask for already existing data in Epic without requesting a fresh report each time a question arises.
-
Teams can start with a population of patients, after which they can filter by relevant criteria, and finally track the measures that matter to the question they are trying to answer.
-
SlicerDicer is used in hospitals for clinical quality, operations, and research. Hence, the value is far beyond just clinical reporting.
-
SlicerDicer does not replace Clarity, Caboodle, Reporting Workbench, Power BI, Tableau, and enterprise BI solutions.
-
Sidekick, offered by Epic, facilitates English-based language queries. Whereas building custom analytics extensions with Intellivon required for integration purposes, dashboarding, data governance, data engineering, and AI may cost anything between $ 70,000 and $ 300,000, apart from Epic licensing costs.
Clinicians and heads of departments get direct access to pull their patient-related data from Hyperspace (clinical interface by Epic) instead of submitting a request to their respective analytics teams to fetch it for them. A quality director looking to follow the trend of readmissions can easily find what he needs without having to ask his analytics team member. Likewise, a revenue cycle manager seeking reasons for denials can use Slicer Dicer himself to investigate them rather than having to wait until his analyst provides him data.
But there’s one catch. This feature does not seem to gain traction despite its ease of use. There is always a small number of people within the hospital who actually learn how to operate the system properly, while everyone else relies on submitting requests to analysts. This problem can be attributed largely to improper configuration and design because proper configuration requires proper setting of subject area, cohort definitions, and appropriate access rights according to user requirements.
In this blog, we will explain SlicerDicer’s data model and features, and how it can benefit your enterprise with several examples ranging from quality reporting, population health initiatives, operations management, to revenue cycle functions. This article further compares SlicerDicer’s capabilities with Reporting Workbench and Clarity reports. We also determine the cost of configuring SlicerDicer with a development partner like Intellivon from scratch.

What Epic SlicerDicer Is and What Healthcare Teams Can Analyze
Epic SlicerDicer is a self-service data exploration tool inside the Cogito analytics suite. It lets healthcare leaders customize complex data searches without writing SQL or waiting on report writers. As a result, clinical and business teams quickly analyze millions of patient records to uncover trends, care gaps, and operational bottlenecks.
For example, a team starts with a diabetic population, filters by HbA1c levels, slices by clinic location, measures the average control rate, and investigates the resulting trends.
1. Patient Population & Inclusion/Exclusion Criteria Design
SlicerDicer defines patient groups by applying clear inclusion and exclusion rules to large health records. Users can choose specific diagnoses, age groups, or visit dates to build an accurate starting cohort. Therefore, teams focus only on the exact patient group that matters for their clinical study.
Technically, this step queries structured data tables inside the Epic Caboodle data warehouse. For instance, systems like UC Davis use these criteria to let staff search millions of patient visits without slowing down the live electronic health record.
Once the main population is set, teams break the data down into specific categories.
2. Slices, Dimensions, and Measure Configuration
Slices divide patient groups into clear categories, while measures calculate numerical summaries like totals, averages, percentages, and variance. Consequently, teams can compare performance across different hospital clinics, age groups, and care teams.
Technically, these calculations map directly to predefined data fields in the Caboodle warehouse. For example, a quality director can measure the average length of stay and slice the numbers by admitting department.
After configuring these measures, users turn the raw numbers into visual charts.
3. Visual Exploration, Drill-Downs, and Free-Text Search
Visual tools turn tabular data into clear bar charts, line graphs, geographic maps, and tree maps. In addition, users can drill down into the underlying data, search free-text lab notes, and jump straight to related medical records.
This visual layer connects directly to indexed clinical databases. Thus, authorized staff can move smoothly from a high-level hospital overview down to line-level patient details.
After finding key patterns, teams save and share their work securely.
4. Session Persistence, Governance, and Cross-Team Sharing
SlicerDicer lets users save dynamic search sessions and share findings safely across clinical departments. Furthermore, role-based access controls protect sensitive health data by showing private patient records only to authorized users.
Technically, saved sessions store the exact query logic and automatically update when new hospital data enters the system. Consequently, leaders always view up-to-date data during quality meetings.
SlicerDicer functions as an active data investigation tool rather than a static dashboard. This exploratory power helps teams find root causes before standardizing new clinical workflows.
How Epic SlicerDicer Turns EHR Data Into Answerable Questions
Epic SlicerDicer converts complex medical records into clear answers by structuring information into organized data models. Instead of writing custom database code, clinical and operational leaders simply choose a patient group and apply specific filters. As a result, teams quickly uncover the real causes behind clinical trends without waiting on technical report writers.
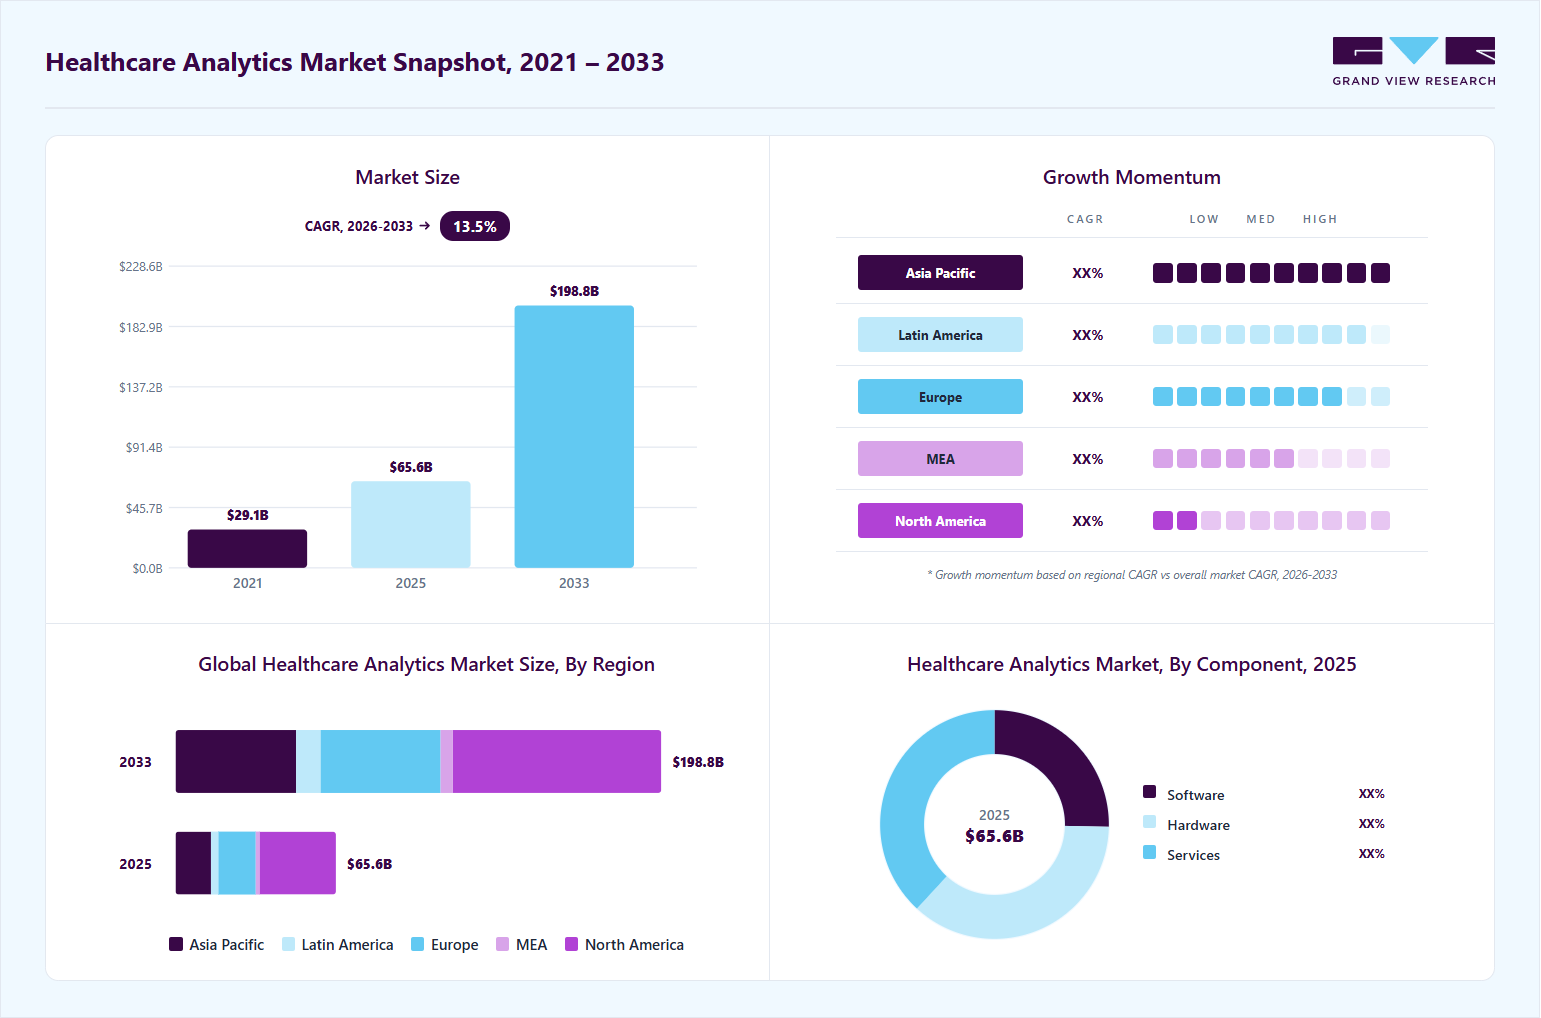
Moreover, the demand for fast data exploration is rising across the entire healthcare sector. Specifically, the global healthcare analytics market is projected to reach $198.8 billion by 2033. This growth occurs because hospital networks actively replace slow IT reporting queues with self-service analytics tools.
1. Start With the Right SlicerDicer Population and Data Model
Before asking a question, leaders must select the correct foundational data model. Otherwise, choosing the wrong starting model will produce answers that look technically correct but fail to help clinical operations.
- Clinical Records: First, teams query patient populations, clinic visits, diagnoses, medical procedures, and lab results.
- Medications & Orders: Next, analysts track inpatient prescriptions, outpatient orders, and exact dose timings.
- Financial Information: Additionally, leaders evaluate billing transactions, charge capture data, and overall revenue cycle details.
- Custom Models: Finally, health systems configure specialized registries tailored to their own internal clinical departments.
Consequently, selecting the proper foundation ensures that every downstream comparison remains accurate.
2. Refine the Question With Filters, Slices, and Measures
Next, teams turn broad business challenges into precise queries by adding targeted filters and numerical measures.
For instance, when hospital executives investigate heart-failure readmissions under the CMS Hospital Readmissions Reduction Program, they organize their search through several logical steps.
- Cohort & Timeframe: First, they isolate heart-failure patients admitted over the past twelve months.
- Clinical Criteria: Then, they filter the group using specific diagnosis codes and active cardiology orders.
- Readmission Metric: Furthermore, they set 30-day unplanned readmissions as their primary measurement.
- Segmentation (Slices): Finally, they slice the results by discharge clinic, insurance payer, and patient age.
However, users must remember that SlicerDicer is not universally real-time. For example, academic medical centers like UCLA Health and Johns Hopkins document that their SlicerDicer datasets are updated nightly via warehouse extracts.
Therefore, teams should use SlicerDicer for fast exploration of historical trends rather than live, minute-by-minute patient tracking.
Where SlicerDicer Fits in Cogito, Clarity, and Caboodle Data
Epic Cogito represents Epic’s complete analytics ecosystem. Within this architecture, SlicerDicer serves as the self-service exploration layer for clinical and operational teams. Meanwhile, tools like Reporting Workbench handle daily operational lists, Radar supports executive dashboards, and systems like Clarity and Caboodle manage deeper enterprise reporting and warehousing.
Academic centers like UC Davis Health categorize Radar, Reporting Workbench, SlicerDicer, Clarity, Caboodle, and Chronicles under this unified Cogito framework. SlicerDicer does not replace the enterprise data warehouse.
Instead, it queries configured Epic data models mapped across the underlying analytics environment.
Comparing Core Analytics Layers Across the Epic Cogito Architecture
| Layer / Tool | Primary Function | Data Source / Mechanism | Target User |
| SlicerDicer | Self-service ad hoc cohort exploration | Configured Cogito data models (Caboodle-backed) | Clinicians, department managers, analysts |
| Reporting Workbench | Operational reporting and real-time patient lists | Chronicles (real-time transactional data) | Charge nurses, clinic staff, billing teams |
| Radar | High-level KPI monitoring and executive dashboards | Aggregates from SlicerDicer, RWB, and metrics | C-suite leaders, clinical directors |
| Clarity | Deep historical relational reporting and compliance | Nightly ETL from Chronicles | Certified SQL developers, report writers |
| Caboodle | Enterprise data warehousing and external data joins | Unified dimensional warehouse (Epic + non-Epic) | BI architects, data engineers, data scientists |
Understanding these distinctions prevents costly architecture mistakes, such as assuming that SlicerDicer is Caboodle itself. Instead, it operates through configured Epic data models that can draw from Caboodle’s dimensional data.
Consequently, health systems route ad hoc exploratory questions to SlicerDicer while using Clarity, Caboodle, and external BI tools for complex SQL modeling, machine learning pipelines, and custom analytics interfaces built around web development best practices such as secure API design, role-based access, responsive visualization, and performance optimization.
Top Epic SlicerDicer Use Cases Across Healthcare Enterprises
Epic SlicerDicer enables cross-functional hospital leaders to uncover trends across clinical, operational, and financial domains. However, SlicerDicer does not improve patient outcomes on its own. Instead, it identifies specific patient populations and operational variations that clinical teams can actively address.
Therefore, health systems deploy this tool across several key enterprise departments to evaluate performance.
Cross-Functional SlicerDicer Enterprise Applications
| Enterprise Function | Questions SlicerDicer Helps Investigate |
| Clinical Quality | Why are 30-day readmissions, inpatient mortality, surgical complications, and hospital-acquired infection rates rising? |
| Population Health | Which geographic cohorts show gaps in diabetes management, hypertension control, cancer screenings, and preventive visits? |
| Pharmacy | How do outpatient antibiotic prescribing patterns, high-dose opioid regimens, and drug utilization vary across clinics? |
| Diagnostics | Where are duplicate laboratory orders, pathology delays, and high-cost imaging overutilization occurring? |
| Operations | What causes high clinic no-show rates, scheduling bottlenecks, patient flow delays, and bed capacity constraints? |
| Emergency Care | How do emergency department patient volumes, triage wait times, and door-to-provider intervals change by shift? |
| Revenue Cycle | Which payer groups account for the highest claim denial rates, underpayments, and delayed charge captures? |
| Research | Does the health system have a viable patient cohort that satisfies specific clinical trial inclusion and exclusion criteria? |
| Workforce | How does clinical activity compare across provider specialties, nursing shifts, and outpatient staffing models? |
For example, Mayo Clinic researchers deployed SlicerDicer analytics within their outpatient network to monitor prescribing variations across clinical encounters.
Consequently, their broader antimicrobial stewardship initiative reduced inappropriate antibiotic prescribing from 23.6% down to 16.4%.
Importantly, this clinical improvement resulted from clinician education and targeted care protocols, while SlicerDicer provided the underlying cohort visibility.
How Leading Health Systems Use SlicerDicer in Real Operations
Leading health systems use Epic SlicerDicer to answer clinical, operational, and financial questions with data already captured across Epic workflows. These organizations analyze prescribing patterns, imaging utilization, research cohorts, and denied claims to identify where teams should intervene, redesign processes, or investigate further.
For healthcare leaders, these deployments provide useful evidence of where SlicerDicer delivers practical value beyond routine reporting.
Enterprise Implementations and Operational Outcomes
| Health System | Publicly Documented Use Case | Key Operational Metric / Outcome |
| Mayo Clinic | Monitored outpatient antibiotic prescribing patterns across clinical encounters. | Reduced inappropriate prescribing from 23.6% to 16.4% within its broader stewardship program. |
| Johns Hopkins Medicine | Used cohort discovery to support research feasibility and preliminary patient counts. | Reduced reliance on manual data requests while working within documented data-refresh limitations. |
| Geisinger Health System | Analyzed longitudinal diagnostic imaging utilization and modality trends. | Identified 121,057 potentially substitutable imaging studies across five years of clinical data. |
| NYU Langone Health | Used SlicerDicer for hypothesis generation, cohort feasibility, and participant recruitment. | Supported faster identification of eligible populations for IRB-approved research protocols. |
| UT Southwestern | Investigated radiation-oncology authorization denials across hospital and professional billing. | Identified $14.8 million in hospital billing and $700,000 in professional billing initial denials. |
In addition, Yale New Haven Health uses SlicerDicer for de-identified cohort exploration and protocol development. Research teams can evaluate potential study populations before moving into more detailed data-request and approval workflows.
The same principle applies when health systems extend these findings into custom dashboards or external analytics applications.
Following web development best practices around secure APIs, role-based access, responsive interfaces, and performance helps ensure that SlicerDicer-derived insights remain usable when they move beyond Epic into broader enterprise workflows.
These examples show that SlicerDicer can support decisions tied to patient safety, research planning, utilization, and revenue performance. The next question is how revenue-cycle teams can use the same analytical approach to identify denial patterns and financial leakage.
How Revenue Cycle Teams Use SlicerDicer to Find Denials and Leakage
Revenue cycle leaders use Epic SlicerDicer to find lost revenue, track insurance denials, and spot billing issues. Instead of waiting for slow monthly finance reports, teams search billing records directly to see why claims get rejected.
For instance, the University of Iowa Healthcare trains staff to use SlicerDicer to monitor insurer payment trends, write-offs, and billing speed.
- Track Denials: Check rejection counts, missing prior authorizations, and final recovery rates by insurance company.
- Inspect Billing: Spot coding errors, missing charges, and paperwork delays before they cause lost income.
- Analyze Insurers: Compare payment speeds across different departments to find low-paying contracts.
At UT Southwestern, leaders used SlicerDicer to uncover radiation-oncology authorization denials worth $14.8 million in hospital billing and $700,000 in doctor fees.
SlicerDicer vs Reporting Workbench, Clarity, Caboodle, and BI
Epic offers different reporting tools for different jobs. For example, SlicerDicer is great for quickly exploring patient groups without writing computer code.
However, health systems need other tools like Clarity, Caboodle, or external dashboards when they must track live patient lists, run complex SQL queries, or predict future risks.
Choosing the Right Tool for Your Data Needs
| What You Need to Do | Best Tool to Use |
| Explore patient groups quickly | Epic SlicerDicer |
| View live daily patient lists | Reporting Workbench |
| Track leadership goals on a dashboard | Radar Dashboards |
| Run deep historical reports with SQL | Clarity & Caboodle |
| Combine hospital data with finance systems | Power BI or Tableau |
| Run predictive AI and machine learning | Custom Healthcare AI Layer |
| Bring in non-Epic data (like lab devices) | Cloud Data Warehouse |
| Build custom bedside apps for doctors | Custom Epic-Integrated App |
Knowing these differences saves healthcare teams time and money. For instance, Johns Hopkins Medicine notes that SlicerDicer cannot search every piece of EHR data, especially free-text doctor notes or records stored outside Epic.
Furthermore, hospital teams often run into walls when they need complex multi-step rules or live minute-by-minute updates. In addition, native tools struggle when leaders want to mix medical records with outside insurance claims or remote patient monitors.
In short, SlicerDicer is ideal for fast data exploration. However, health systems need custom data pipelines and modern integration layers when they want to build predictive AI tools.
How SideKick, BI, and Custom AI Extend Epic SlicerDicer Analytics
Healthcare leaders often need deeper insights than standard reporting can provide. Rather than modifying Epic’s core software, health systems build custom data layers around it.
By connecting data pipelines, business intelligence tools, and external artificial intelligence, organizations turn standard historical reports into proactive, automated workflows.
1. Extend Epic Analytics With Enterprise BI and Data Pipelines
Hospital networks frequently combine electronic health records with outside business data to get a complete financial and operational picture. Consequently, technical teams build secure pipelines to move data from Epic into modern cloud systems.
- Data Sources: Teams pull records from Clarity, Caboodle, and approved FHIR API endpoints to feed cloud data lakes.
- Outside Datasets: Pipelines blend clinical records with commercial payer claims, remote patient monitoring devices, and CRM systems.
- Custom Dashboards: Data engineers build executive dashboards using tools like Power BI, Tableau, or custom React interfaces.
For laboratory-heavy environments, an epic beaker api integration can also connect specialized lab data with broader clinical and analytics workflows.
Connecting these data streams gives leaders a single view of both hospital operations and patient trends.
2. Add Predictive and Generative AI Outside the Query Layer
Standard database queries show what happened in the past. In contrast, adding an external AI layer helps hospital leaders predict what will happen next.
- Risk & Capacity: Machine learning models predict claim denial risks, 30-day readmissions, and hospital bed shortages before they occur.
- Automated Insights: Generative AI spots clinical anomalies and writes natural-language summaries for executive teams.
- Actionable Care: Intelligent systems rank care gaps to help clinical teams prioritize high-risk patients first.
According to Epic Healthcare Intelligence documentation, the embedded SlicerDicer SideKick assistant lets users build queries using plain English prompts. This feature makes it much easier for staff to search records without learning query syntax.
However, SideKick mainly simplifies how users build queries inside Epic. When a health system needs to train custom predictive models, combine outside insurance data, connect specialized systems, or trigger automated workflows across third-party applications, an external enterprise AI layer becomes essential.
How Healthcare Enterprises Govern SlicerDicer Access and PHI
Healthcare enterprises govern SlicerDicer access by strictly enforcing role-based permissions and data-minimization standards across all user groups.
Under the HHS HIPAA Privacy Rule, organizations must restrict access to protected health information (PHI) to the minimum necessary required for specific job functions.
Consequently, hospital IT teams configure data models to control who sees aggregate summaries versus identifiable records.
Controlling Data Access, Visibility, and Research Permissions
To maintain compliance, hospital systems apply clear guardrails across several key analytics areas:
- Role-Based Access Controls (RBAC): First, administrators assign model access based on job duties. For example, UC Davis Health restricts deeper database access to staff with specific certifications and organizational roles.
- Aggregate vs. Identifiable Views: Next, operational leaders can review broad population trends, while line-level chart drill-downs are locked to authorized clinical staff.
- Research vs. Operations: Furthermore, institutions separate research from daily hospital tracking. For instance, Yale School of Medicine gives researchers de-identified data for protocol design and study feasibility without requiring immediate IRB sign-off.
- Exports and Audit Trails: Additionally, security teams strictly limit CSV or Excel exports and track all user queries through automated audit logs.
- External BI Protection: Finally, when health systems pipe data into outside reporting tools, they maintain the same row-level security across external databases.
In short, solid governance lets staff explore clinical trends safely without risking patient privacy.
How We Scale SlicerDicer Analytics Across Your Enterprise
Scaling self-service analytics across a hospital system requires clear data governance, aligned clinical definitions, and structured user adoption. Without standard rules, different departments define basic terms like “active patient” or “readmission” in conflicting ways.
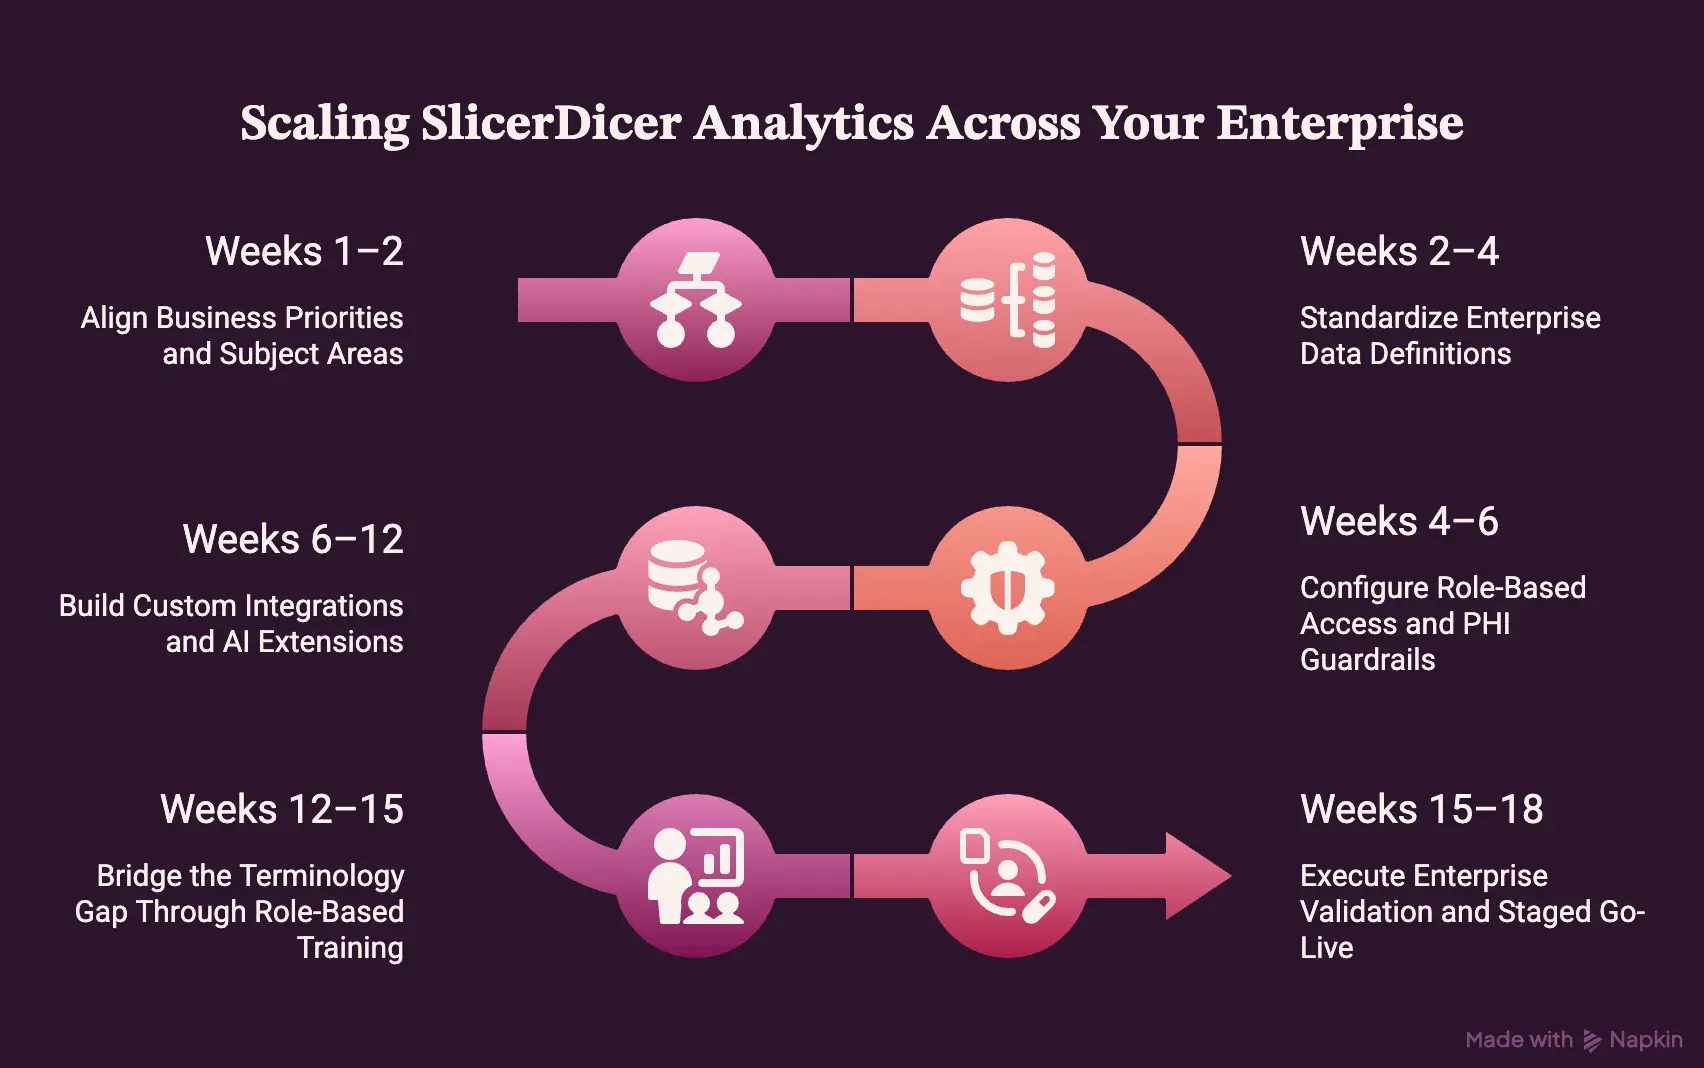
As a result, our team deploys a structured, six-step framework to ensure every analytical query delivers reliable, enterprise-grade business value.
Our Proven 6-Step Implementation and Extension Framework
- Align Business Priorities and Subject Areas (Weeks 1–2): First, we identify your organization’s highest-priority clinical, operational, and financial questions. Then, we map these objectives to specific SlicerDicer data models and Caboodle subject areas.
- Standardize Enterprise Data Definitions (Weeks 2–4): Next, our team works with clinical and finance leaders to establish single-source-of-truth definitions for metrics like denials, readmissions, and provider attribution. This step prevents conflicting metrics across departments.
- Configure Role-Based Access and PHI Guardrails (Weeks 4–6): Furthermore, we implement strict role-based access controls and minimum-necessary privacy filters. This ensures staff can explore aggregate trends safely while restricting patient-level drill-downs to authorized users.
- Build Custom Integrations and AI Extensions (Weeks 6–12): In addition, when native data models reach their limit, we build secure pipelines connecting Epic Caboodle to external claims, remote devices, and predictive machine learning models.
- Bridge the Terminology Gap Through Role-Based Training (Weeks 12–15): As training programs at institutions like Baylor note, gaps between clinical terms and technical database fields frequently slow user adoption. Therefore, we provide role-specific training, curated query templates, and dedicated office hours to build internal data literacy.
- Execute Enterprise Validation and Staged Go-Live (Weeks 15–18): Finally, we run user acceptance testing across clinical champion networks before launching across the full health system.
A typical custom extension program takes 3 to 7 months depending on technical scope and data complexity.
By following this phased roadmap, health systems eliminate reporting backlogs and turn self-service exploration into measurable operational ROI.
What Epic SlicerDicer Customization and Analytics Costs in 2026
Enterprise customization, data engineering, BI, and AI development around an existing Epic SlicerDicer environment typically requires a $70,000–$300,000 engineering budget. Importantly, this is an estimated custom-development range for external data pipelines, custom BI, and machine learning extensions, not Epic’s proprietary SlicerDicer license price.
Consequently, health systems budget these programs across several distinct engineering phases to manage scope and timeline effectively.
Estimated Custom Analytics and Engineering Cost Breakdown
| Development Phase | Estimated Cost |
| Discovery and Analytics Requirements | $8,000–$20,000 |
| Data Models and Subject-Area Mapping | $12,000–$40,000 |
| Clarity / Caboodle / FHIR / Data Integration | $15,000–$60,000 |
| Custom Analytics and BI Interfaces | $20,000–$70,000 |
| Optional AI / Predictive Analytics Layer | $0–$60,000 |
| Security, Validation, UAT, Training, Go-Live | $15,000–$50,000 |
| Total Program Range | $70,000–$300,000 |
Planning an Epic analytics expansion? [Request a SlicerDicer Extension Cost Assessment] with our engineering team to map your data sources, pipeline integrations, BI requirements, AI opportunities, and realistic implementation range before budgeting the build.
Beyond the initial deployment, health systems typically budget 15% to 25% of the initial development cost annually for ongoing support. Specifically, this recurring budget covers:
- Routine monitoring and proactive pipeline performance tuning.
- Ongoing data model adjustments following major Epic system upgrades.
- Custom metric creation and subject-area reconfigurations.
- Integration maintenance for non-Epic feeds, third-party claims, and remote devices.
- Regular security patches, audit log reviews, and access governance updates.
By establishing clear budgets upfront, healthcare leaders can build scalable data architectures that maximize their existing EHR investments.
When to Build Custom AI and BI Layers Around Epic SlicerDicer
Native SlicerDicer works well when staff simply need to explore patient groups inside Epic.
However, health enterprises choose engineering partners like Intellivon when they need to link medical records with outside data pipelines, smart apps, predictive AI tools, or executive dashboards.
1. Connect With Epic Without Replacing Your Existing System
Our team treats Epic as your main source of truth while adding new analytics tools around it using approved healthcare standards. As a result, hospital teams get advanced analytics without disrupting daily doctor workflows.
- Main System: First, Epic stays the central record system for all patient and billing data.
- Secure Connections: Next, we use approved SMART on FHIR tools and data extracts to move information safely.
- Combined Data: Furthermore, cloud systems clean and combine hospital records with outside data in real time.
- Custom Views: Finally, smart AI models and clean dashboards deliver clear answers directly to hospital leaders.
This approach keeps your healthcare data pipelines fast, secure, and fully compliant with privacy rules.
2. Build Only What Native Epic Tools Cannot Do
We focus engineering work only on the tasks that built-in Epic reporting cannot handle on its own.
- Combine Outside Systems: Blend hospital records with outside insurance claims, business tools, and remote home health devices.
- Predict Future Risks: Run AI models to spot billing denial risks, predict bed shortages, and flag readmission chances early.
- Automate Daily Tasks: Send automatic alerts and update work queues when patient data changes.
- Custom Dashboards: Build tailor-made dashboards for department heads and executive teams.
Ready to Extend SlicerDicer Into Enterprise Healthcare Analytics?
If your teams find data in Epic easily but struggle to turn it into predictive tools or automated workflows, you do not need to replace SlicerDicer. Instead, you just need to add the missing analytics piece.
At Intellivon, we help healthcare leaders review their Epic data flows, integration pipelines, and privacy safeguards before investing in custom engineering.
Talk with our healthcare data and AI integration engineers.
Conclusion
Epic SlicerDicer is a powerful tool for fast, self-service cohort exploration across hospital records. However, true enterprise analytics often requires going beyond native EHR reporting.
When health systems combine SlicerDicer with custom data pipelines, cloud warehouses, and predictive AI models, they turn everyday historical searches into automated clinical and financial improvements. The goal is not replacing your EHR, but building the right analytics layers around it.
FAQs
Q1. When should I use SlicerDicer vs Reporting Workbench?
A1. First, use SlicerDicer when you need fast, self-service population trends and multi-variable cohort exploration across historical data. In contrast, switch to Reporting Workbench when you need real-time, actionable patient lists, daily clinical work queues, or immediate operational tracking directly within active electronic health record workflows.
Q2. Why can’t I find the data I need in SlicerDicer?
A2. Often, this occurs because the specific data point is not included in your chosen data model. In addition, SlicerDicer cannot easily search unstructured, free-text doctor notes. Furthermore, records stored in non-Epic systems or external claims will remain unavailable unless actively mapped into your Caboodle warehouse.
Q3. Is SlicerDicer really real-time?
A3. Generally, no. While query execution is fast and interactive, most health systems update their underlying SlicerDicer data models nightly through automated warehouse extracts. Consequently, teams should rely on SlicerDicer for longitudinal population analysis rather than live, minute-by-minute patient census tracking or active emergency room monitoring.
Q4. Can SlicerDicer handle complex cohort logic?
A4. Yes, but only up to a certain point. SlicerDicer easily manages standard inclusion, exclusion, and multi-layer filters. However, when queries require complex nested conditions, cross-system joins, or advanced statistical functions, data engineering teams typically build custom SQL data models inside Clarity, Caboodle, or external warehouses.
Q5. Can SlicerDicer accurately calculate readmissions?
A5. Yes, provided your organization standardizes the underlying clinical definitions. Specifically, SlicerDicer measures 30-day unplanned readmissions across defined cohorts. However, if departments disagree on attribution rules or encounter criteria, the numbers will diverge. Therefore, establishing unified metrics across Caboodle models is essential for accurate reporting.
Q6. Can SlicerDicer pull historical patient census or care-team data?
A6. Yes, as long as historical encounters and provider attribution are configured in your subject areas. Moreover, users can slice historical volumes by unit or clinical specialty. However, tracking shifting, minute-by-minute staffing ratios is better suited for operational reporting tools like Reporting Workbench or Clarity.
Q7. Can SlicerDicer export patient-level data to Excel securely?
A7. Yes, but strict role-based access controls govern this feature. Furthermore, administrators restrict line-level protected health information exports to authorized personnel only. In addition, all data downloads trigger automated audit logging, which ensures that external spreadsheets comply fully with organizational governance and federal HIPAA privacy standards.