Key Takeaways:
- Epic Caboodle is Epic’s data warehouse for clinical, financial, operational, and population health reporting.
- It organizes complex Epic data into simpler models so healthcare teams can run reports, compare trends, and study outcomes more easily.
- Caboodle receives data through Clarity ETL pipelines and can also include outside data such as claims, finance, and research records.
- Teams use Caboodle with SlicerDicer, SQL, Power BI, and Tableau for reporting, research, population health, and deeper analytics.
- How Intellivon extends Epic Caboodle: We build ETL, BI, cloud, governance, and AI layers around Epic. Custom work usually costs $70,000–$300,000, excluding Epic licensing
Healthcare data is spread out over a number of systems, and taking several years’ worth of it and putting it all into a single view takes up more time than most teams can spare. Epic Caboodle was created to eliminate that gap, wherein it is Epic’s dimensional data warehouse and brings together clinical, financial, and operational data into a single structure that is designed for trend analysis, and not for daily transactions.
Yet, when the system is turned on, data scientists rarely receive something useful immediately. If the appropriate subject areas have not been included in the model, a simple question can take weeks to answer, and the teams have to rebuild the joins that analysts previously prepared in Clarity. However, if the model and pipeline are correctly set up, the gap quickly narrows: almost 97% of healthcare data remains unused, mostly because it is locked up in separate systems rather than in a single warehouse.
We have created Caboodle warehouses for health systems when they make that particular move, and the work which yields results takes place before anyone opens a BI tool by properly mapping subject areas with intent. That is why this blog looks at Caboodle’s architecture, its data model, how it compares with Clarity, the integration of BI and ML, and what a well-designed warehouse actually looks like.

What Is Epic Caboodle and What Can It Do For Your Enterprise
Epic Caboodle is an enterprise data warehouse within Epic’s analytics ecosystem. Specifically, it transforms healthcare data into a dimensional structure designed for faster and more repeatable analysis of clinical, financial, operational, and population-health information.
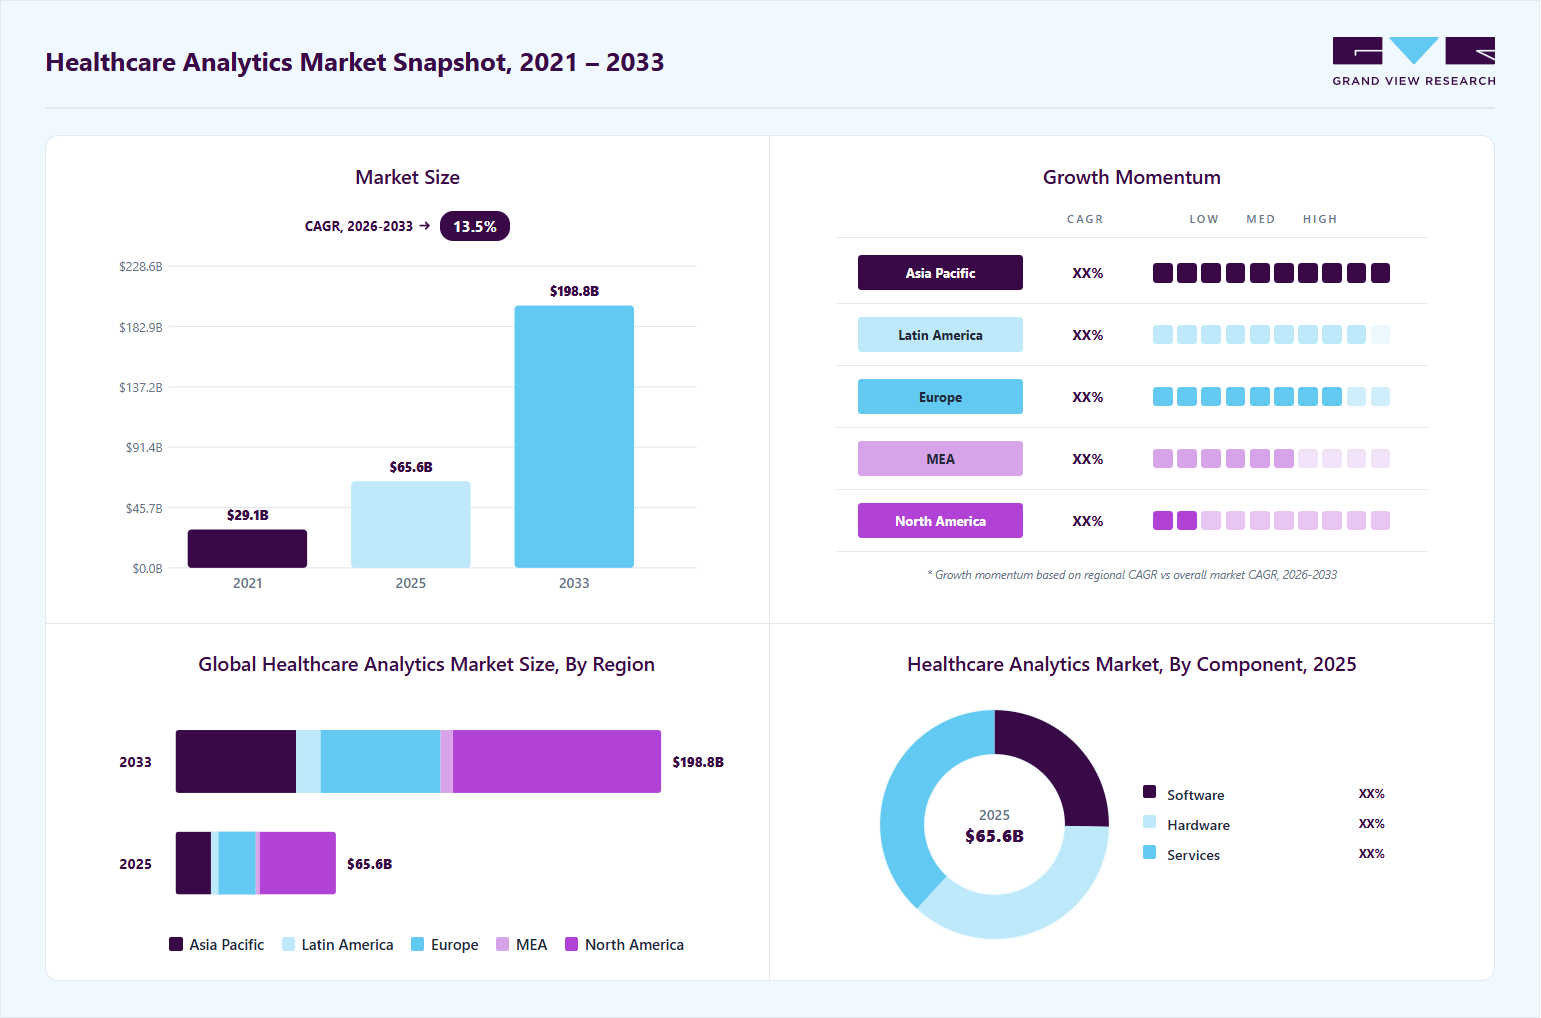
According to Grand View Research, the global healthcare analytics market will expand from $81.9 billion in 2026 to $198.8 billion by 2033. This trajectory reflects a compound annual growth rate (CAGR) of 13.5%. Rising EHR data volumes and demand for value-based clinical intelligence fuel this steady enterprise growth.
So, what does that actually mean for your reporting teams day-to-day?
- Enterprise data warehouse: Caboodle consolidates data from across Epic into one analytical structure.
- Dimensional design: Unlike Clarity’s relational tables, Caboodle uses a star-schema model built for faster querying.
- Analytical purpose: It supports clinical, financial, operational, and population health reporting from a single source.
1. What Epic Caboodle Actually Does
Caboodle takes raw operational data and organizes it into healthcare concepts analysts can query directly. Because of this structure, teams spend less time writing complex joins and more time answering actual business questions.
- Historical data: Retains longitudinal records for trend analysis over time.
- Consolidated analytics: Combines clinical, financial, and operational data in one warehouse.
- Standardized structures: Uses star schemas with fact and dimension tables for consistency.
- Repeatable reporting: Supports aggregation and trend analysis without rebuilding logic each time.
2. Who Uses Caboodle Inside a Health System
Technical teams work directly inside Caboodle, while senior leaders typically consume the outputs those teams produce. As a result, the warehouse serves two very different audiences with two very different needs.
- Direct users: Enterprise data engineers, BI developers, Caboodle developers, and analytics teams.
- Domain teams: Clinical informaticists, population health teams, finance and RCM analysts, quality teams, and researchers.
- Output consumers: Senior leadership generally reviews dashboards rather than writing queries.
Caboodle’s value comes from making Epic data analytically usable. It complements Epic’s operational systems rather than replacing them.
To see why that distinction matters, the next step is to place Caboodle inside Epic’s wider data stack.
Where Epic Caboodle Fits Within Epic’s Healthcare Data Stack
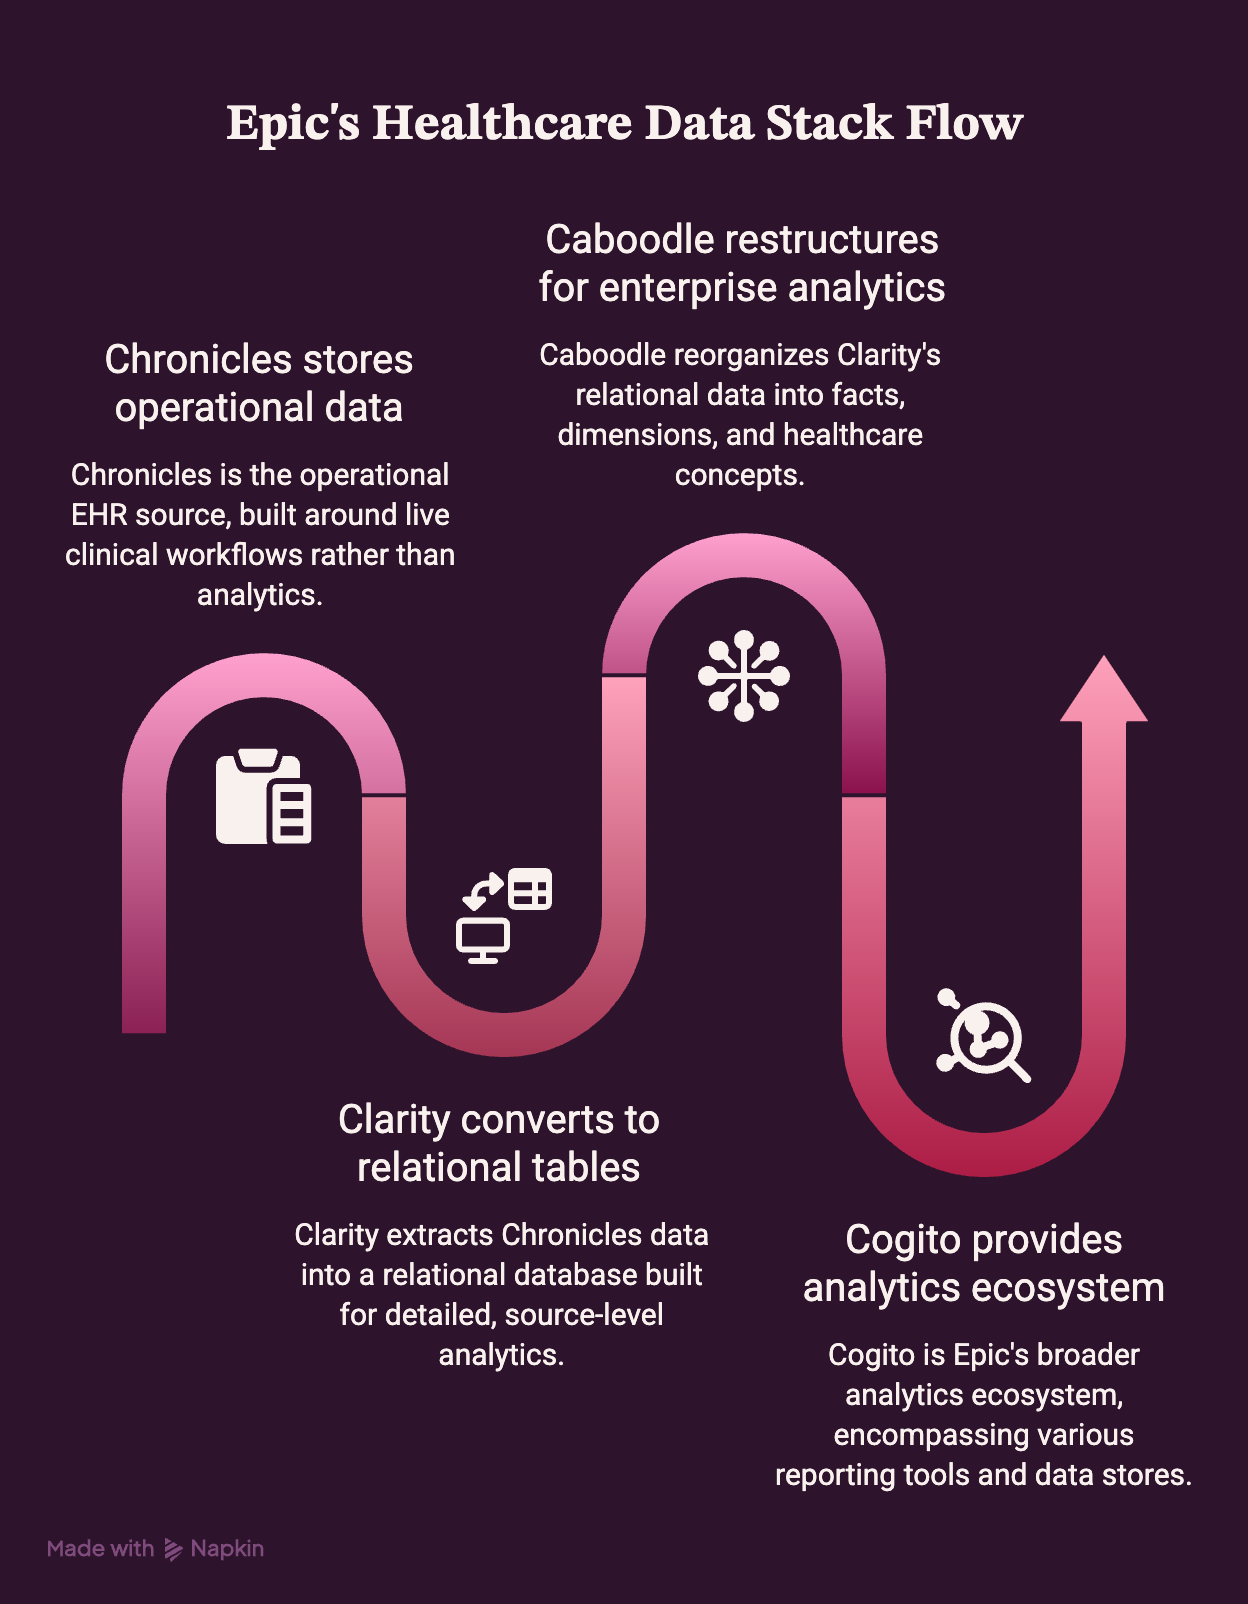
Caboodle sits downstream from Epic’s operational data and is designed for analytics rather than transactional care delivery. As a result, it never touches live clinical workflows directly. Instead, it receives already-processed data through a defined extraction path.
According to UC Davis Health’s clinical data source documentation, Clarity runs as a nightly extract from Chronicles, while Caboodle runs its own nightly extract from Clarity, organizing that data into a star schema built around business concepts.
1. Chronicles Stores Operational Epic Data
Chronicles is the operational EHR source, built around live clinical workflows rather than analytics.
Because it’s transactional by design, it isn’t structured as an enterprise analytical warehouse.
- Transactional core: Handles real-time documentation, orders, and results.
- Workflow-optimized: Built for clinical speed, not query performance.
2. Clarity Converts Epic Data Into Relational Tables
Clarity extracts Chronicles data into a relational database built for detailed, source-level analytics.
With thousands of underlying tables, it gives qualified analysts SQL-level access to granular records.
- Relational structure: Thousands of tables organized around clinical entities.
- Analyst access: SQL-fluent teams query Clarity directly for detailed reporting.
3. Caboodle Restructures Data for Enterprise Analytics
Caboodle then reorganizes Clarity’s relational data into facts, dimensions, and healthcare concepts.
Consequently, this structure supports derived metrics and analytics-friendly queries at enterprise scale, refreshing through its own scheduled ETL cycle that runs after Clarity’s nightly extract completes.
- Dimensional transformation: Converts detailed records into fact and dimension tables.
- Concept-based organization: Groups data around healthcare concepts rather than raw tables.
4. Cogito Provides the Wider Analytics Ecosystem
Cogito is Epic’s broader analytics ecosystem, rather than a separate database.
UC Davis Health describes it as encompassing Radar, Reporting Workbench, SlicerDicer, Analytics Catalog, and Epic’s data stores, including Clarity, Caboodle, and Chronicles.
These layers are complementary rather than competing. Therefore, Caboodle becomes easier to understand once its native warehouse features are separated from the analytics applications built on top of it.
Which Epic Caboodle Features Make Healthcare Analytics Easier?
Caboodle’s most important features are structural rather than cosmetic. Specifically, they include a dimensional healthcare model, standardized ETL, fact and dimension tables, subject-area organization, external-data support, metadata tools, and downstream support for analytics applications like SlicerDicer.
Together, these features are what separate a data warehouse from a simple reporting database.
Epic Caboodle Feature Overview
| Capability | What It Does | Why Analytics Teams Care |
| Dimensional model | Structures business concepts around facts and dimensions | Easier analysis with fewer complex joins |
| Fact tables | Stores measurable events like encounters or charges | Supports aggregation and trend reporting |
| Dimension tables | Adds descriptive context like patient or provider | Enables slicing and filtering |
| ETL | Transforms upstream Clarity data on a scheduled cycle | Standardizes analytics across the enterprise |
| Data dictionary | Documents table structures and definitions | Faster data discovery for new analysts |
| External data | Adds non-Epic sources like claims or registries | Broader enterprise view beyond Epic alone |
| SlicerDicer support | Feeds Epic’s self-service exploration tool | Less dependence on SQL for end users |
| Custom extensions | Adds organization-specific tables and columns | Supports local reporting needs |
According to Epic Caboodle documentation, Caboodle ships with hundreds of integrated tables and thousands of standardized fields across clinical, operational, and financial domains, and organizations can extend that model without losing the changes during upgrades.
These features work together rather than in isolation, since a dimensional model without a data dictionary or ETL discipline loses much of its analytical value. They make more sense once you see how the dimensional model itself organizes healthcare information.
What Healthcare Data Can Epic Caboodle Bring Together?
Caboodle can support multiple healthcare domains at once, though actual availability depends on implementation scope and how source data gets configured.
Consequently, two health systems running Caboodle can have very different subject-area coverage depending on what their teams chose to extend and integrate.
Epic Caboodle Data Domain Coverage
| Data Domain | Typical Information | Example Analytical Question |
| Patient | Demographics, coverage | Which populations need intervention? |
| Encounter | Admissions, discharge, location | Where is utilization increasing? |
| Diagnosis | Conditions | Which conditions drive length of stay? |
| Medication | Orders and administration activity | Where are medication trends changing? |
| Laboratory | Orders and results | Where are turnaround delays occurring? |
| Procedure | Procedural data | How is procedural volume changing? |
| Scheduling | Appointments | Which clinics have no-show problems? |
| Revenue cycle | Charges, payer information | Where is financial leakage occurring? |
| Population health | Cohort-related data | Which groups have unresolved care gaps? |
| External | Non-Epic enterprise data | What changes when claims data gets added? |
Each domain sits inside Caboodle’s broader subject-area structure, so a question about diagnosis trends often pulls from the same encounter and patient dimensions a scheduling question would use.
As a result, analysts build one query pattern and reuse it across multiple domains rather than starting from scratch each time. Revenue cycle and payer data add a financial layer on top of clinical detail, which is what allows a single Caboodle report to connect charge capture directly to the encounters that generated it.
Caboodle’s real value comes from how many domains it connects in one place, rather than from a single subject area on its own.
Therefore, having the data available does not automatically mean Caboodle is the correct layer for every query, which is where the Clarity comparison becomes important.
Epic Caboodle vs Clarity: Which Analytics Layer Should You Use?
Use Caboodle when the organization needs standardized, repeatable enterprise analytics. Alternatively, use Clarity when analysts need deeper source-level Epic detail that Caboodle has not modeled.
In fact, mature Epic environments commonly use both layers side by side rather than picking one permanently.
Epic Caboodle vs Clarity Comparison
| Question | Caboodle | Clarity |
| Main purpose | Enterprise analytics | Detailed Epic reporting |
| Structure | Dimensional | Relational and normalized |
| Data detail | Curated | More granular |
| Standard metrics | Strong fit | Often requires custom logic |
| Source investigation | Limited | Strong |
| SlicerDicer | Primary source layer | Upstream source |
| BI dashboards | Strong fit | Possible |
| Custom SQL | Yes | Yes |
| External data | Supported | Less central |
| Live transactions | No | No |
Specifically, Vanderbilt’s Clinical Informatics Center documents this distinction directly. According to their Epic data resources guide, Caboodle contains most, but not all, of the data available in Clarity, while also adding external data linkages that Clarity does not include.
As a result, organizations that rely on Caboodle alone sometimes hit a wall when a specific data element was never modeled into it in the first place.
1. Use Caboodle for Repeatable Enterprise Analytics
Caboodle fits questions that repeat across time and departments, since its structure is built for that pattern.
Consequently, executive KPIs, population trends, utilization tracking, and quality dashboards all draw on the same standardized facts and dimensions.
- Executive reporting: Consistent metrics leadership can track month over month.
- Population trends: Longitudinal views across large patient groups.
- Quality dashboards: Standardized measures pulled from curated subject areas.
2. Use Clarity When Detailed Epic Records Matter
Clarity fits questions that need source-level detail Caboodle has not modeled or has simplified away.
Therefore, an obscure data element, a regulatory investigation, or a debugging session tracing why two reports disagree all point back to Clarity.
- Source investigation: Tracing a metric back to its raw Epic origin.
- Regulatory work: Audit-ready detail that curated dimensions can obscure.
- Metric debugging: Identifying why Caboodle and Clarity numbers differ.
3. Use Clarity and Caboodle When Analytics Requires Scale
Because of this relationship, analytics teams usually route questions to whichever layer fits, rather than forcing every query through one database.
Otherwise, problems arise when organizations force all analytics through one layer instead of defining which questions belong in which data store.
Ultimately, Caboodle and Clarity solve different problems, and treating them as interchangeable is where most reporting friction starts.
For many clinical and business users, however, they never query Caboodle directly, since their access comes through SlicerDicer instead.
How SlicerDicer Uses Caboodle for Self-Service Analytics
SlicerDicer provides self-service exploration over configured Epic data models, while Caboodle provides the underlying warehouse data those analyses actually run on. Specifically, research literature confirms SlicerDicer pulls its information directly from Caboodle after the Clarity-to-Caboodle ETL process completes each night, with published clinical research describing SlicerDicer as a tool built for self-service population exploration.
1. How SlicerDicer Queries Caboodle Data Models
SlicerDicer follows a simple workflow: select a population, apply filters, choose measures, segment results, and visualize the output.
Because this entire process runs against Caboodle’s dimensional model, users get near-instant results without writing SQL.
- Population selection: Users start with a broad group, such as all patients seen in a department.
- Filtering and slicing: Age, diagnosis, or visit location narrows the population step by step.
2. What Healthcare Teams Can Analyze Without SQL
Clinical and operational teams can explore diagnoses, demographics, procedures, and cohort comparisons directly, without SQL expertise.
One published study specifically describes SlicerDicer as letting users search a defined patient population to answer questions about diagnoses, demographics, and procedures performed.
- Common use cases: Diagnosis trends, demographic breakdowns, and procedural volume.
- Population comparisons: Side-by-side views across different patient cohorts.
3. When SlicerDicer Is Enough
Epic SlicerDicer works well when a question fits Caboodle’s existing configured models. Therefore, self-service exploration is often sufficient when no custom user experience or complex external-data blending is required.
- Good fit: Standard cohort questions, quick trend checks, department-level exploration.
- Not required: Custom dashboards, multi-source blending, or scheduled distribution.
4. When Custom BI Becomes Necessary
Custom BI becomes necessary once requirements move beyond what SlicerDicer’s configured models support.
- Common triggers: Cross-business analytics, advanced visualization, or custom applications.
- Where this leads: Power BI, Tableau, or a governed semantic layer built on Caboodle.
SlicerDicer and custom BI serve different scales of the same underlying question, so the right choice depends on complexity, not preference.
Therefore, whether the healthcare analysis happens through SlicerDicer or custom BI, the value still depends on the business and clinical decisions Caboodle helps teams make.
Where Healthcare Enterprises Create Value With Epic Caboodle
Caboodle creates value when its standardized data structures support repeatable decisions about patient populations, quality, capacity, revenue, and research.
Consequently, the real payoff shows up across seven distinct areas, each pulling from the same underlying dimensional model.
Epic Caboodle Use Cases by Healthcare Domain
| Use Case | Required Caboodle Domains | Output | Decision Supported |
| Clinical quality and outcomes | Encounter, diagnosis, medication, lab | Readmission, LOS, mortality, infection trends | Where should quality interventions focus? |
| Population health and chronic disease | Patient, diagnosis, encounter, medication | Diabetes, hypertension, cardiovascular, oncology trends | Which patient groups need proactive outreach? |
| Care gap, SDOH, and health equity | Patient, external, encounter | Screening gaps, follow-up gaps, disparity segmentation | Where are care gaps concentrated by population? |
| Scheduling, capacity, and patient flow | Scheduling, encounter | No-show rates, ED throughput, OR utilization | Where is capacity underused or overloaded? |
| Revenue cycle and denials | Revenue cycle, encounter, external | Charges, coding accuracy, denial trends | Where is revenue leaking across the cycle? |
| Provider and workforce | Encounter, provider, department | Productivity, workload, department volume | How is workload distributed across providers? |
| Research and real-world evidence | Patient, diagnosis, encounter, external | Cohort discovery, observational outcomes | Which cohorts fit a specific research question? |
Revenue cycle teams use the same dimensional structure differently, tracing denial patterns back to specific payers and procedure codes rather than clinical outcomes. Provider analytics, meanwhile, connects encounter volume directly to department-level staffing questions.
Caboodle itself does not make decisions. Its value is in giving teams a governed base from which those decisions can be made repeatedly.
Several health systems have already extended this pattern beyond standard Epic reporting. Mount Sinai, for example, layers Caboodle data into its own Mount Sinai Data Warehouse, remapping it into an OMOP Common Data Model to support broader research and data-sharing initiatives, which shows where the warehouse can become a broader analytics foundation
How to Extend Caboodle With BI, Cloud, and External Data
Caboodle can remain the governed Epic analytics source while external platforms handle visualization, enterprise data consolidation, cloud scale, or specialized workloads.
As a result, extending Caboodle doesn’t mean replacing it, since the warehouse continues to serve as the trusted historical layer underneath everything built on top.
1. Connect Caboodle With Power BI and Tableau
Power BI and Tableau connect to Caboodle through standard SQL database connections, typically with read-only access.
Consequently, teams build semantic models on top of Caboodle, apply row-level security, and schedule refreshes to keep dashboards current.
Supplementary analysis also notes that these BI connections generally require a signed BAA and specific security controls given the PHI involved.
2. Move Analytical Workloads Into Snowflake or Databricks
Cloud platforms like Snowflake and Databricks let teams combine Caboodle data with far more external sources than Epic’s native environment supports.
Because these platforms separate storage from compute, they handle large-scale modeling and data science workloads more efficiently than Caboodle alone.
3. Combine Epic With Claims and Enterprise Data
Claims, CRM, ERP, cost accounting, workforce, and patient engagement data all extend Caboodle’s clinical picture into a fuller enterprise view.
Therefore, revenue and population health questions that Epic data alone can’t answer become answerable once these sources are integrated.
4. Build Custom Data Marts for Specific Teams
Oncology, finance, operations, research, and population health teams often need narrower, purpose-built views rather than the full Caboodle model.
Building custom marts for each team keeps queries fast without sacrificing the shared governance underneath.
5. Use Separate Pipelines for Near-Real-Time Analytics
Caboodle should not be positioned as a native real-time warehouse, since its ETL cycle runs nightly and can leave data up to a day behind live activity. Instead, real-time needs should route through FHIR, HL7 interfaces, or operational APIs built specifically for that purpose.
Extending Caboodle works best when each new layer has a clear job, rather than stretching Caboodle to do everything at once.
Once that broader data architecture exists, Caboodle can also become a governed historical source for predictive analytics and machine learning.
How We Extend Epic Caboodle for Enterprise Analytics
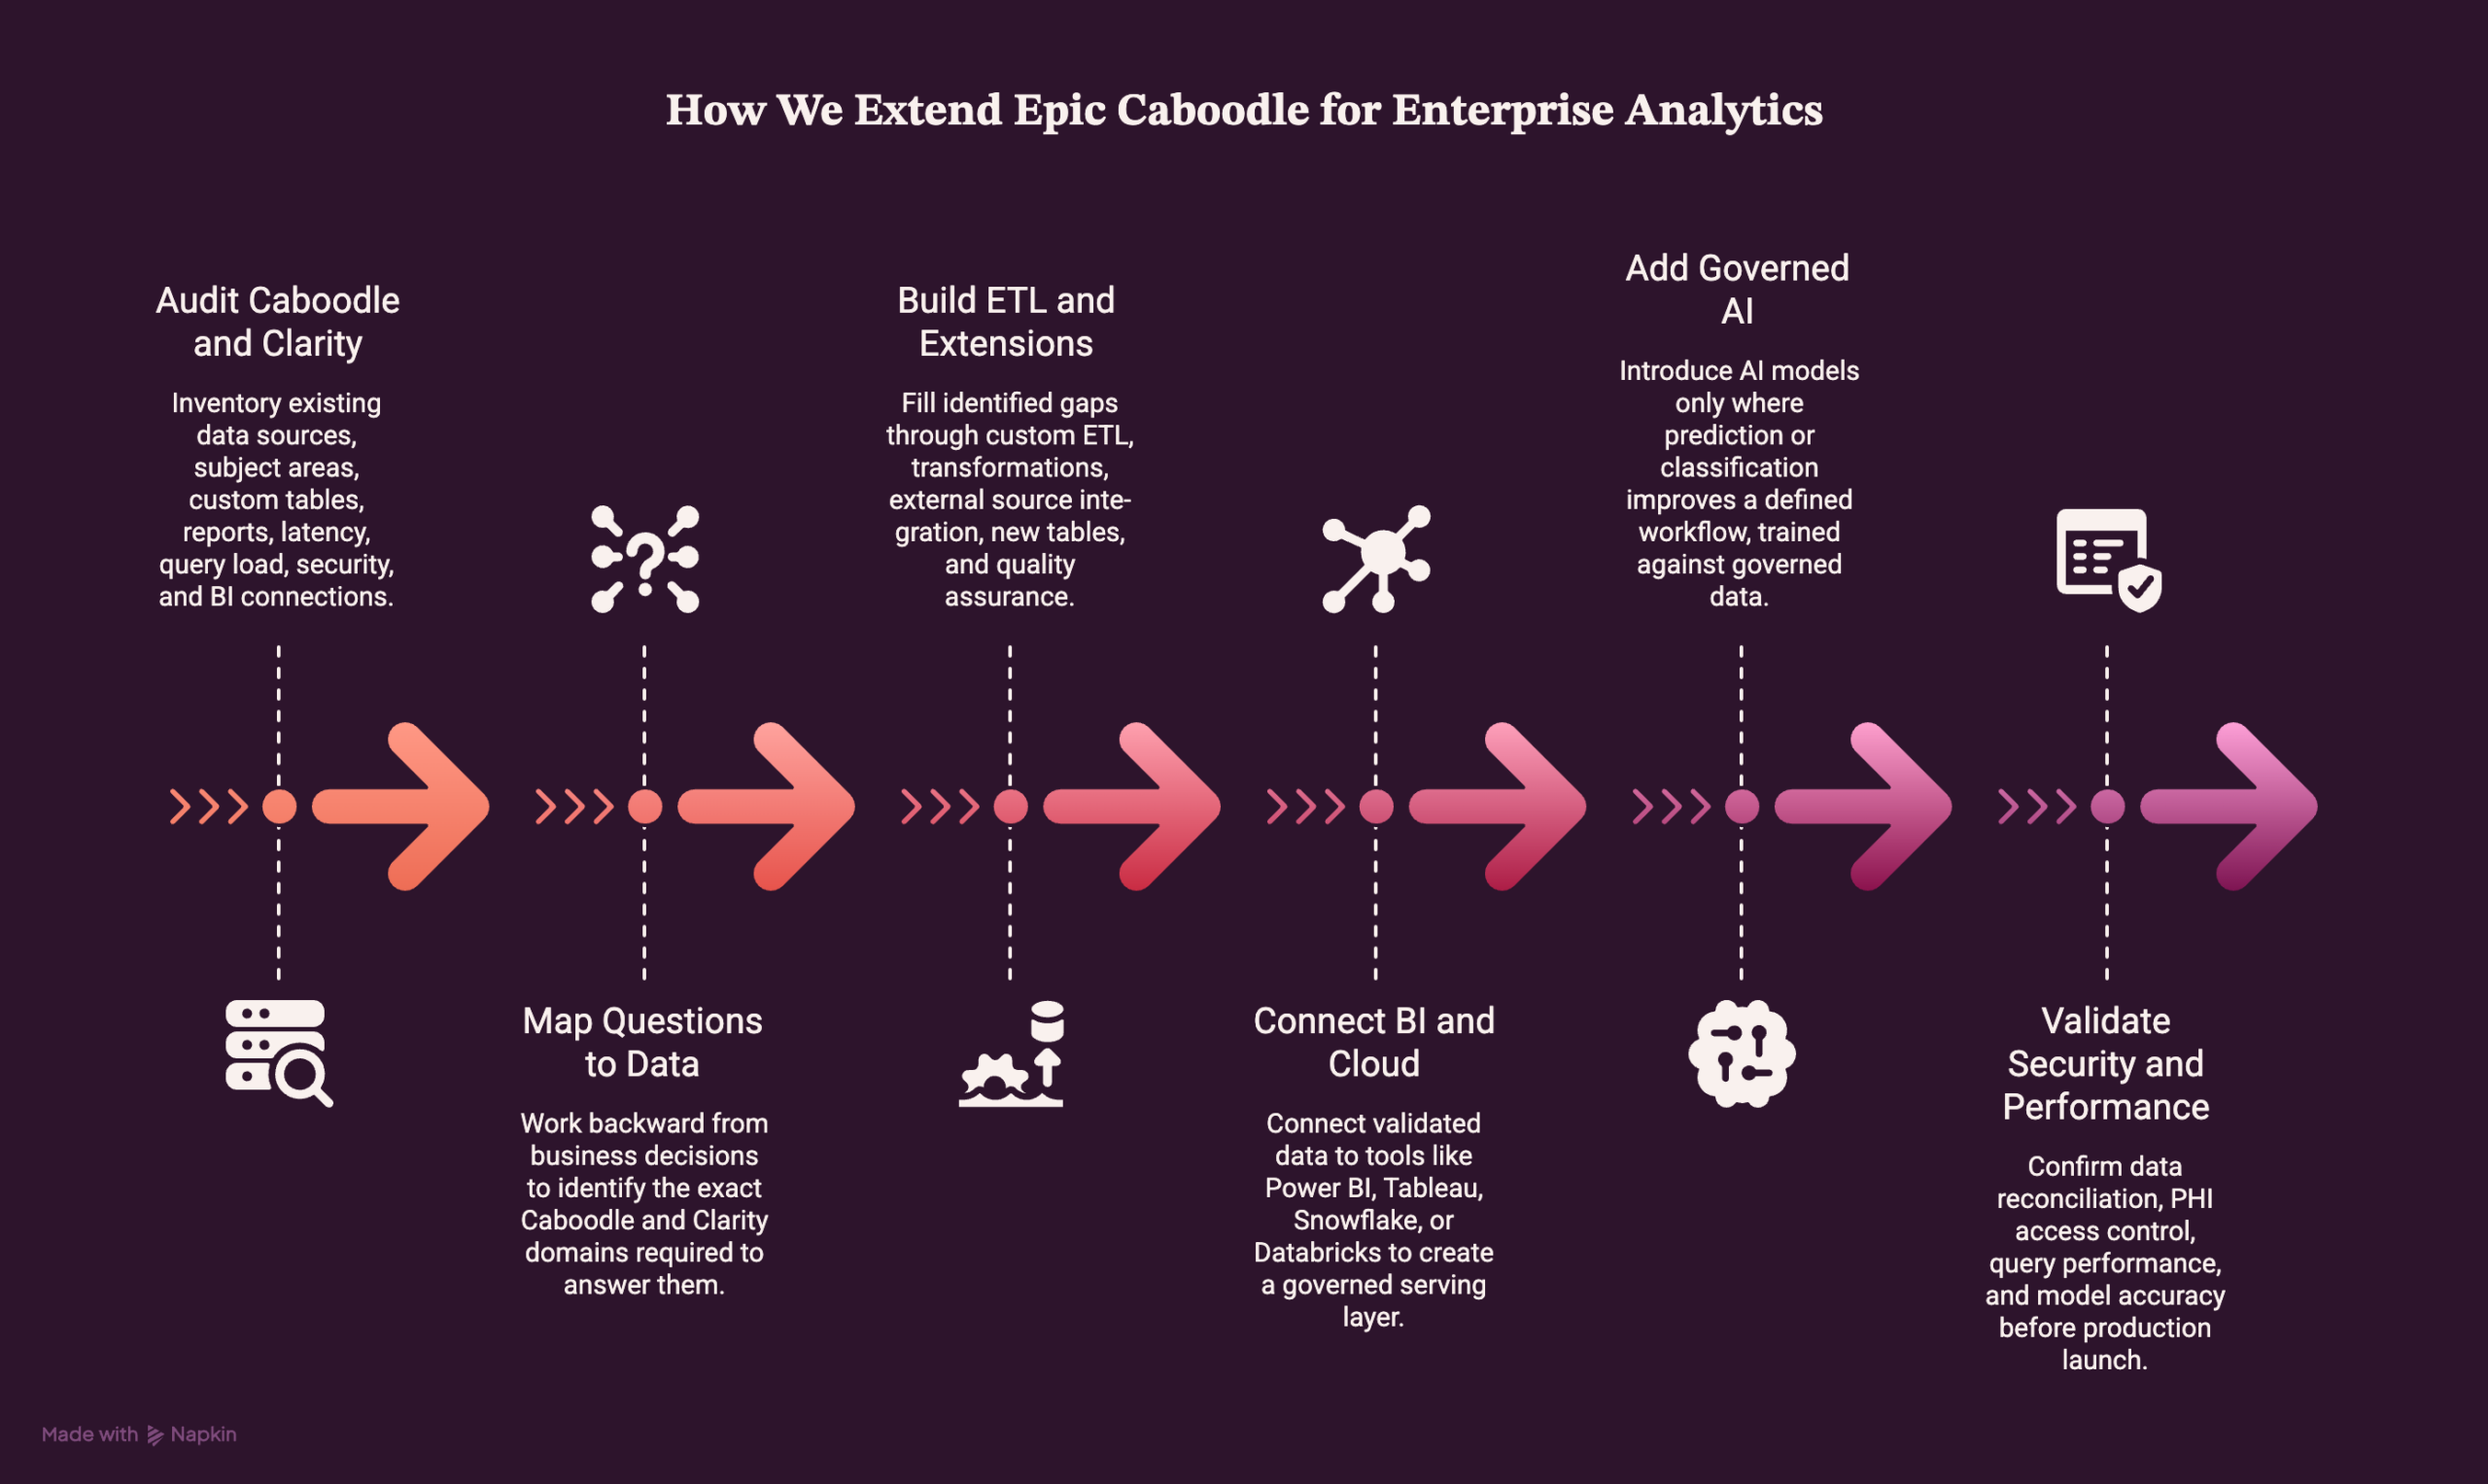
Intellivon’s approach starts with the existing Epic environment and determines which requirements belong in Caboodle, which require Clarity, and which should be handled by external BI, cloud, integration, or AI infrastructure.
Because Epic’s core environment stays untouched throughout, the guiding principle is simple: build around Epic, never modify it.
1. Audit Existing Caboodle and Clarity Data
The first step inventories what already exists across both Caboodle and Clarity before any new work begins. As a result, teams start from an accurate picture instead of assumptions about what the environment currently supports.
- What gets audited: Data sources, available subject areas, custom tables, current reports, data latency, query load, security configuration, and existing BI connections.
- Intellivon’s approach: We produce a full data architecture assessment before recommending any changes, so decisions get made against real inventory rather than guesswork.
2. Map Business Questions to Required Data
This step starts with decisions, rather than dashboards, since the goal is answering a specific question rather than building a generic report.
For example, a question like “which patients are most likely to miss post-discharge follow-up” maps directly to patient, encounter, scheduling, diagnosis, and utilization data.
- What this involves: Working backward from a business decision to the exact Caboodle and Clarity domains that answer it.
- Intellivon’s approach: We build a data requirement matrix for each priority question, so every subsequent step ties back to a decision someone actually needs to make.
3. Build Missing ETL and Data Extensions
This step fills any gaps identified in the audit through custom ETL, extensions, or new tables. Consequently, transformations, external source integration, incremental loads, and quality assurance all happen before anything reaches a report or dashboard.
- What this involves: Transformation logic, external data sources, custom table design, incremental load configuration, QA checks, and data lineage documentation.
- Intellivon’s approach: We keep custom logic isolated and clearly documented, so extensions survive Epic upgrades without becoming untraceable technical debt later.
4. Connect BI and Cloud Analytics Platforms
This step connects the validated Caboodle and Clarity data to the tools end users actually work in, whether that’s Power BI, Tableau, Snowflake, or Databricks. Therefore, the output of this step is a governed analytical serving layer rather than a collection of disconnected dashboards.
- What this involves: Semantic modeling, connection configuration, row-level security, and refresh scheduling across each connected platform.
- Intellivon’s approach: We build one governed serving layer that every BI tool draws from, so business logic never gets duplicated across platforms.
5. Add Governed AI Where Prediction Adds Value
AI only gets introduced where prediction or classification genuinely improves a defined workflow, not because a stakeholder wants “AI” attached to a dashboard.
Readmission risk, denial prediction, utilization forecasting, capacity planning, and case prioritization are common examples where this bar gets cleared.
- What this involves: Defining the specific decision AI needs to improve before any model gets built, then training against governed Caboodle and Clarity data.
- Intellivon’s approach: We apply a strict decision criterion before recommending any model, since AI without a clear workflow improvement adds cost without adding value.
6. Validate Security, Metrics, and Performance
The final step confirms that data reconciles correctly, PHI access stays properly controlled, and performance holds up under real query load before anything reaches production. Meanwhile, if AI models are part of the build, this step also validates their outputs against verified historical data.
- What this involves: Reconciliation testing, user acceptance testing, PHI access review, query load testing, ongoing monitoring setup, metric validation, and model validation where applicable.
- Intellivon’s approach: We treat validation as one coordinated pass across data, security, and performance together, rather than three separate afterthoughts tacked on before launch.
These six steps move a Caboodle environment from fragmented reporting to a governed foundation multiple teams can build on. Once the required architecture is defined, the next decision is how much custom engineering the organization should budget.
What Does Custom Epic Caboodle Development Cost in 2026?
Custom analytics, integration, BI, cloud, and AI work around an existing Epic Caboodle environment typically requires $70,000 to $300,000 in engineering budget, excluding Epic licensing.
Note: This is an Intellivon custom-development planning range, not a price Epic publishes or sets, since Epic licensing and core infrastructure costs are negotiated separately through Epic directly.
Epic Caboodle Custom Development Cost Breakdown
| Workstream | Planning Range |
| Discovery and architecture | $8K–$20K |
| Caboodle models and extensions | $12K–$40K |
| ETL and external integrations | $18K–$60K |
| BI and cloud analytics | $15K–$50K |
| AI and ML extensions | $15K–$70K |
| Security, UAT, and go-live | $10K–$40K |
| Typical total program | $70K–$300K |
These line items represent alternative and overlapping workstreams within a single engagement.
Therefore, their maximum values should never be added together to infer a project price above $300,000, since most projects draw from several rows simultaneously rather than maxing out every category.
1. What Keeps a Project Near $70,000?
Projects land near the lower end when scope stays tightly defined around a specific need. Limited subject areas, one dashboard stack, few external sources, no complex AI, existing governance, and a single facility or use case all keep budgets contained.
2. What Pushes Caboodle Projects Toward $300,000?
Projects move toward the higher end as scope and complexity expand across the organization.
Multi-hospital deployments, many external feeds, cloud analytics, large data volumes, custom data marts, AI components, and high compliance or governance requirements all add cost.
3. What Does Ongoing Maintenance Cost?
Ongoing maintenance for the custom layer typically runs 15% to 25% of the initial engineering cost annually.
Note: This is an Intellivon planning estimate for the custom analytics layer specifically, and not Epic’s own maintenance or licensing pricing.
Maintenance generally covers ETL upkeep, schema change management, dashboard updates, performance monitoring, security review, cloud infrastructure costs, and model retraining where AI components exist.
Conclusion
Ultimately, Epic Caboodle is rarely the limiting factor in healthcare analytics maturity. Instead, the real question is which decisions belong in Caboodle, which need Clarity’s granular detail, and which require external BI, cloud, or governed AI.
Once that routing gets defined clearly, Caboodle performs exactly as designed.
Therefore, the organizations that scale successfully architect around Caboodle rather than force every question through it.
Build Your Epic Caboodle Analytics Layer With Intellivon
At Intellivon, we help hospital networks, academic medical centers, and integrated delivery networks extend Epic Caboodle into a governed analytics and AI foundation.
With deep experience across healthcare data engineering, BI architecture, and compliance-ready AI systems, we help analytics teams move from fragmented Caboodle reporting to a structured, scalable data layer.
A. We Help You Define the Right Caboodle Scope
Before any development starts, we audit your existing Caboodle and Clarity environment, map business questions to the data that actually answers them, and identify where gaps exist.
This keeps the first phase focused on decisions your teams need to make, not features for their own sake.
We help you plan:
- Caboodle and Clarity data inventory
- Business question to data-domain mapping
- BI and cloud integration scope
- AI and ML use case validation
- Governance and security requirements
- Implementation timeline and budget
B. We Build Governed Analytics Around Real Reporting Needs
Analytics infrastructure should support the questions your quality, population health, revenue cycle, and operations teams are already asking, not add another system they have to work around.
Intellivon builds ETL, data marts, and BI connections around your actual Caboodle subject areas.
Your build can include:
- Custom ETL and data extensions
- Power BI, Tableau, Snowflake, or Databricks connections
- Governed semantic layers for enterprise BI
- Predictive models for readmission, denial, or capacity
- External data integration for claims, CRM, or SDOH sources
- Ongoing monitoring and metric validation
C. We Design With Security and Compliance From Day One
Caboodle environments carry PHI across every subject area, so security can’t be a final checklist item.
Intellivon builds role-based access, audit logging, and HIPAA-aligned controls directly into the architecture from the start.
Ready to Build a Governed Caboodle Analytics Layer?
If you’re evaluating how to extend Epic Caboodle for BI, cloud analytics, or AI, Intellivon can help map the right architecture before development begins.
FAQs
Q1. Is Epic Caboodle a Real-Time Data Warehouse?
A2. Generally, no. Instead, Caboodle refreshes through scheduled ETL cycles that run nightly in most environments. Consequently, data can be up to 24 hours behind live activity. Therefore, workflows needing real-time information should route through Chronicles or FHIR interfaces rather than Caboodle.
Q2. What If the Data We Need Is Missing From Caboodle?
A2. First, confirm whether the data exists in Clarity, since Caboodle doesn’t contain every Clarity field. Next, verify its grain and business definition. Then, assess whether a Caboodle extension or external data source fills the gap, and validate results after the next ETL cycle.
Q3. Should Power BI Connect to Caboodle or Clarity?
A3. Generally, Power BI should connect to Caboodle for standardized, enterprise-wide analytics. However, connect to Clarity when detailed source-level data is required instead. In more complex environments, hybrid semantic models pulling from both sources often work best.
Q4. Can Caboodle Connect With Snowflake or Databricks?
A4. Yes, through appropriately designed data pipelines, replication or ELT patterns, and downstream analytical architecture. That said, this typically requires custom integration work rather than a single built-in connector, so proper pipeline design matters more than the platform choice itself.
Q5. Can Caboodle Data Train Healthcare AI Models?
A5. Yes, Caboodle works well as a governed historical training source for healthcare AI models. However, model training, deployment, monitoring, and inference should generally run outside Caboodle itself, since the warehouse is built for analytics rather than active ML operations.
Q6. Should We Extend Caboodle or Build a Cloud Data Warehouse?
A6. This depends on where your data actually lives. If Epic dominates your data landscape, stay Caboodle-first. If multi-system data dominates instead, go cloud-first. When both apply, a hybrid approach works best, and research-focused teams should also consider common models like OMOP.