Key Takeaways:
-
Real-time healthcare analytics platforms range from basic dashboards to AI-powered risk scoring systems.
-
HL7 v2 feeds, FHIR R4 APIs, ADT streaming, and device data integration are core technical requirements.
-
AI risk scoring, alerting, MLOps, audit trails, and cloud scaling define advanced enterprise capabilities.
-
Basic MVPs cost $70,000 to $110,000 while AI-powered platforms reach $200,000 to $300,000.
-
How Intellivon builds real-time healthcare analytics platforms as secure infrastructure rather than static business intelligence dashboards.
When you start scoping analytics platform development cost for a real-time build, the number usually lands between $70,000 and $300,000. Where you fall in that range depends on how much existing infrastructure can be reused, and how much needs to be built from scratch. Most dashboards today are not actually live. They only refresh on a schedule, often overnight. So by the time a capacity issue or a deteriorating patient shows up on screen, the moment has usually already passed.
Here is the architecture decision most cost estimates skip over. Real-time only happens with an event-driven streaming layer underneath, like Kafka or change data capture, doing the actual work. Without it, you have only built a dashboard that refreshes faster, not one that reacts to events as they happen. A real-time sepsis warning system at Johns Hopkins, called TREWS, diagnosed sepsis nearly two hours earlier than standard methods. When providers acted on an alert within three hours, in-hospital mortality dropped by 18.7%, according to a 2022 study in Nature Medicine.
Intellivon builds that streaming layer first, before any dashboard gets designed, since the pipeline is what actually makes a platform real-time. This blog walks through every phase that follows, from stream ingestion to ML inference, dashboards, HIPAA compliance, and maintenance. By the end, you will know where your number falls.

What is a Real-Time Healthcare Analytics Platform?
A real-time healthcare analytics platform is an enterprise data infrastructure that processes streaming clinical, operational, and financial data with sub-second latency. Unlike legacy batch systems that update overnight, this platform ingests live feeds from electronic health records (EHRs), medical devices, and admission systems instantly.
The core architecture consists of four distinct technical layers that directly dictate your overall analytics platform development cost:
- A Streaming Ingestion Layer: Built on event-driven engines like Apache Kafka to capture live data feeds.
- A Stream Processing Engine: Powered by technologies like Apache Flink to calculate active metrics instantly.
- An In-Memory Analytics Database: Utilizing cloud data lakehouses to store and query volatile data points safely.
- A Dynamic Visualization Interface: Serving live clinical dashboards and instant push-alerting engines to frontline medical teams.
By unifying these components, health systems can transition from retrospective reporting to active, immediate clinical decision support.
Since this blog focuses on the cost aspect of the platform, if you want to know more about why your organization needs a real-time healthcare analytics platform and the ROI it can generate for you, check out our detailed post on Building a Secure Patient Data Analytics Platform.
Why Are Enterprises Adopting This Platform?
Enterprises are adopting real-time healthcare analytics platforms because they enable proactive, data-driven decision-making that improves patient outcomes, reduces costs, and addresses critical operational challenges like staffing shortages and value-based care transitions.
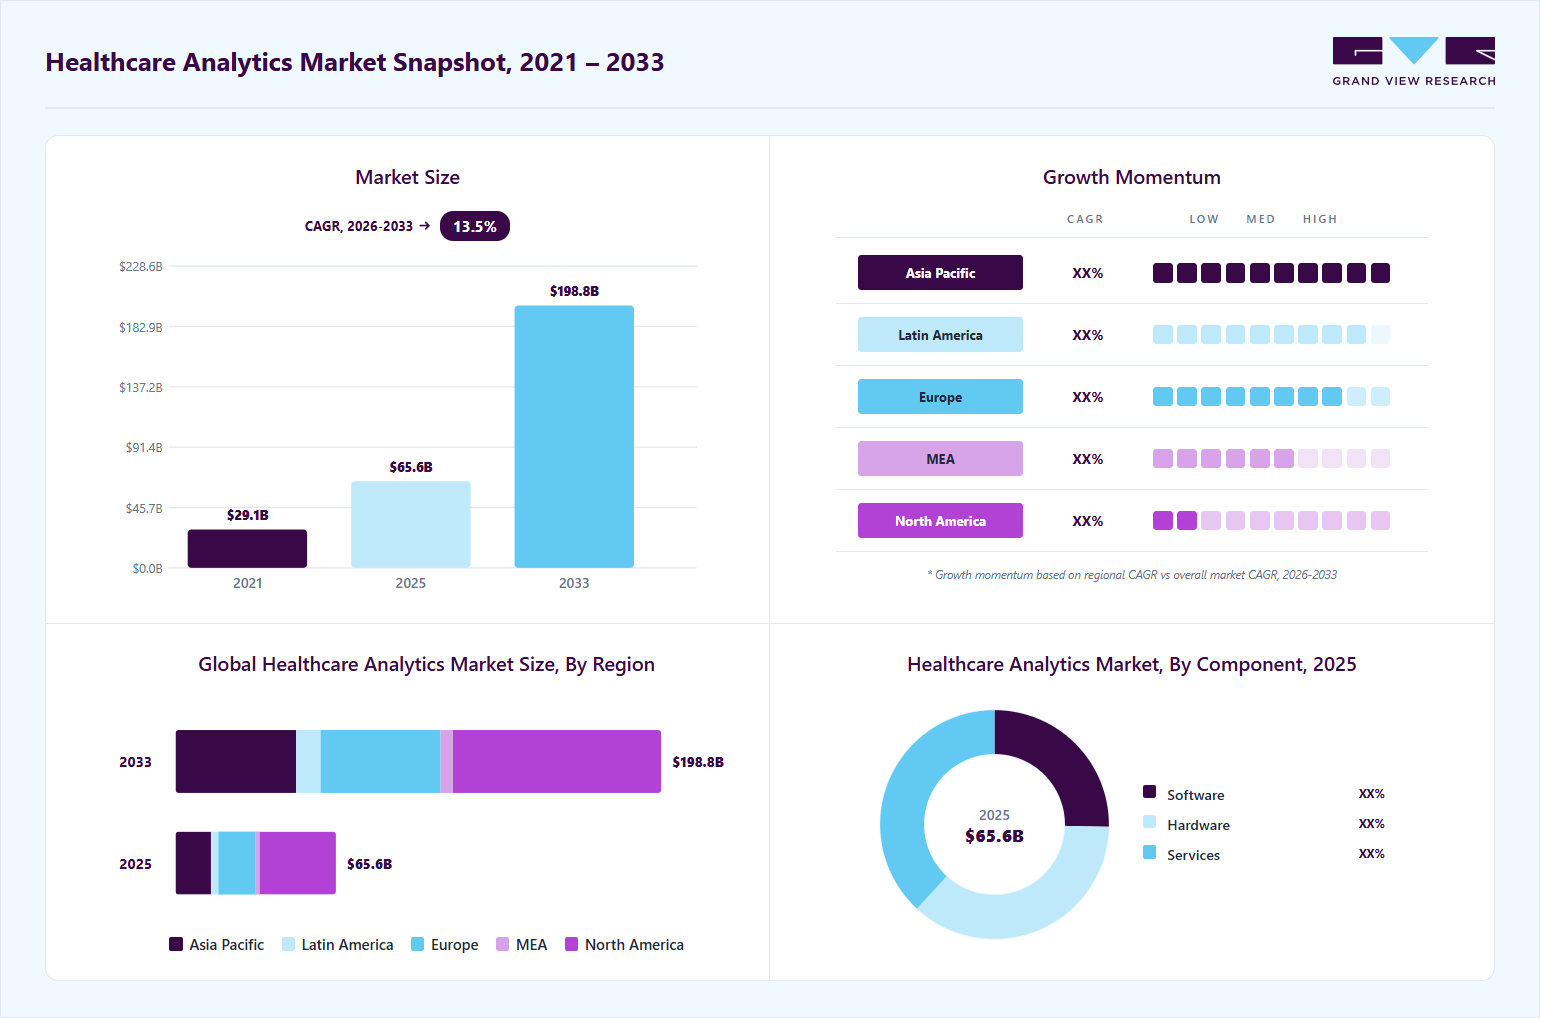
Healthcare has already decided that analytics matters, which leaves the open question of what real-time access to that data actually changes. Adoption numbers alone do not tell that story.
So the sections below focus on what shifts once data moves from a monthly report to something a clinician, scheduler, or finance team can act on the moment it happens.
1. Adoption Already Has Executive Buy-In
Analytics adoption no longer needs justification at the leadership level. 93% of healthcare executives now consider analytics essential to running their organization, so budget conversations have already shifted from whether to invest to how fast implementation can move. The real friction now sits entirely on architecture and integration decisions.
2. Real-Time Detection Is Already Saving Lives
Real-time detection is already changing outcomes, not just promising to. At Johns Hopkins, a sepsis warning system called TREWS reduced in-hospital mortality by 18.7% when providers acted within three hours. Minutes of earlier detection translate directly into survival, and that same logic now extends into ICU monitoring and deterioration scoring.
3. The Savings Are Measured in Billions
The financial case here is measured in billions. Big data analytics carries an estimated $300 billion in annual savings potential across the U.S. health system, spread across reduced readmissions, fewer unnecessary tests, and tighter fraud detection, before any operational efficiency gains are even counted.
4. Real-Time Analytics Is Easing the Staffing Crisis
Staffing shortages are not solved by hiring alone. Predictive scheduling tools, built on real-time demand data, cut the impact of staff shortages by 25% in hospitals that use them, by matching staff levels to actual patient volume instead of guessing from last month’s averages, a gap nurse leaders feel daily.
5. Value-Based Care Is Forcing the Real-Time Shift
Value-based care does not run on a monthly reporting cycle, and that mismatch is driving real-time adoption forward. 47% of healthcare organizations have already adopted real-time analytics specifically for this transition, since outcome-based contracts need visibility into performance and cost as it happens, not weeks later.
6. Real-Time Data Is Replacing the Batch Report
The shift from historical to real-time data changes what care teams can actually act on. Some systems now flag early signs of sepsis up to 30 minutes before symptoms become obvious. That window is often the difference between catching a complication early or missing it.
The pattern across every category is the same: real-time access turns data that used to explain what already happened into data that changes what happens next. That shift is now worth billions in savings and, in cases like sepsis detection, measured in lives.
Analytics Platform Development Cost: $70K–$300K Breakdown
An enterprise analytics platform development cost typically ranges from $70,000 to $300,000, depending on data source volume, streaming infrastructure complexity, dashboard depth, AI model integration, and HIPAA compliance controls.
While the lower end of this range supports a focused real-time dashboard MVP with one or two live data feeds, the higher end delivers a multi-source, AI-powered system with predictive risk scoring, an automated alerting engine, MLOps monitoring, and audit-ready production scale.
Cost Tier Table
| Cost Tier | Core Focus | Primary Data Feeds | Advanced Features |
| $70,000–$110,000 | Focused Real-Time Dashboard MVP | 1–2 Sources (e.g., ADT feed, single EHR) | Basic role-based access, simple push alerts |
| $120,000–$190,000 | Multi-Source Streaming Analytics | Multiple Feeds (EHR, Labs, Medications, Claims) | Data lakehouse, multi-role dashboards, low-latency ETL |
| $200,000–$300,000 | AI-Powered Real-Time Analytics | Comprehensive Enterprise & IoT Feeds | Real-time ML inference, sepsis alerts, MLOps pipeline |
1. $70,000–$110,000 For A Real-Time Dashboard MVP
A $70,000 to $110,000 budget delivers a focused real-time healthcare dashboard MVP designed to track core metrics from one or two live data streams.
This entry-tier deployment provides foundational visibility into localized operational workflows without the overhead of advanced machine learning or sprawling, multi-facility integrations.
To deploy this minimum viable product, the technical build focuses strictly on establishing basic, secure data ingestion and standard visualization layers:
- ADT feed streaming: Captures live admission, discharge, and transfer events to monitor real-time bed utilization.
- Basic real-time ETL pipeline: Ingests raw messages from a single EHR endpoint and structures them for immediate, low-latency viewing.
- Operational dashboard cost healthcare: Powers clean UI modules for immediate insight into patient flow and ED throughput metrics.
- HIPAA compliance cost analytics platform: Embeds standard data encryption at rest and in transit alongside role-based access control.
When clinical leaders decide to aggregate disparate datasets like lab systems and claims files alongside live EHR events, the infrastructure requirements naturally transition into the mid-tier investment bracket.
2. $120,000–$190,000 For Multi-Source Streaming Analytics
A $120,000 to $190,000 budget supports a comprehensive real-time clinical analytics platform development cost range that unifies multiple operational, clinical, and financial feeds into a single data layer. This tier allows healthcare organizations to cross-reference distinct historical and live datasets to generate deeper operational and clinical insights.
At this level, the architecture expands from a simple pipeline into a scalable data lakehouse capable of processing complex, concurrent message volumes:
- HL7 v2 real-time feed cost: Integrates standard legacy feeds alongside modern FHIR R4 subscription API endpoints.
- Real-time lab result streaming: Connects diagnostic laboratory information systems directly to the central data lakehouse environment.
- Real-time medication data streaming: Tracks active pharmacy orders and medication administration records instantly to minimize clinical errors.
- Claims data streaming integration: Merges real-time financial tracking with clinical timelines to monitor the revenue cycle and denials.
As clinical data streaming matures, organizations typically seek to move beyond passive data display and enter the upper cost tier by embedding proactive, predictive intelligence directly into the care environment.
3. $200,000–$300,000 For AI-Powered Real-Time Analytics
A $200,000 to $300,000 budget supports an AI-powered real-time analytics platform cost range that injects live predictive modeling, machine learning inference, and automated clinical alerting into active hospital workflows.
This advanced tier fits enterprise hospital networks requiring instant risk stratification, automated early warning scores, and continuous clinical model monitoring.
Building this intelligence layer requires advanced infrastructure capable of scoring high-velocity data pipelines against trained machine learning models with sub-second latencies:
- ML model real-time inference cost: Runs active scoring engines on streaming patient data to identify emerging critical events.
- Sepsis alert real-time system cost: Monitored by a deterioration detection streaming system that flags subtle changes in vital signs.
- Length of stay prediction cost: Generates active discharge prediction models from the moment of patient admission to optimize capacity planning.
- MLOps pipeline cost real-time analytics: Integrates automated model drift monitoring to maintain clinical safety and algorithmic accuracy over time.
This breakdown provides transparency into initial capital allocations and shows how specific architecture choices drive the development budget. The next sections will explore the detailed costs associated with building these foundational data ingestion pipelines and compliance frameworks.
What You Can Build At Each Healthcare Analytics Budget Tier
The overall healthcare analytics platform build cost depends far less on your total dashboard count and much more on data velocity, stream latency, governance depth, and your direct clinical workflow actions.
A $70,000 minimum viable product (MVP) serves perfectly to prove localized, real-time operational visibility for a single department. Meanwhile, a mid-tier $190,000 deployment scales up to unify disparate enterprise streams, and a comprehensive $300,000 system embeds predictive analytics, automated alerting, active MLOps, and rigorous, multi-tenant compliance controls.
Budget Tier Development Table
| Budget Tier | Core Focus | Architecture & Capabilities | Recommended Use Cases |
| $70K–$110K | Live Visibility for One Workflow | Single cloud environment, 1–2 data streams, basic web visualization, standard encryption. | Bed utilization, ED throughput, lab turnaround tracking, discharge queues. |
| $120K–$190K | Multi-Source Aggregation | Reusable stream processing, multi-source real-time ETL pipelines, BI tool integration, identity matching. | Patient flow, capacity planning, quality measure tracking, revenue cycle analytics. |
| $200K–$300K | Predictive & Action-Oriented AI | Real-time ML inference, automated alerting engines, MLOps monitoring, high availability, zero-trust security. | Readmission risk, length of stay prediction, acuity-based staffing, automated sepsis alerts. |
1. The $70K–$110K MVP: Live Visibility For One Workflow
A $70,000 to $110,000 minimum viable product should focus strictly on one measurable, high-impact operational workflow. This strategic scope keeps your initial data engineering overhead tightly controlled while giving health system leadership definitive proof that live data delivery can drastically accelerate decision speeds.
To keep implementation timelines lean, this entry-tier build maps a single ingestion feed to a focused user interface:
- Real-time healthcare dashboard development cost: Covers the implementation of basic, low-latency data rendering pipelines.
- Operational dashboard cost healthcare: Powers live operational tracking screens for frontline staff.
- Basic data visualization platform cost: Utilizes lightweight web frameworks or cloud-native containerized apps.
- Basic PHI security real-time analytics: Enforces strict role-based access controls and standard cloud environment encryption.
Recommended use cases:
- Bed utilization analytics: Tracks active occupancy, clean-up turnarounds, and direct floor transfers.
- ED throughput analytics: Highlights emergency department bottlenecks, boarding times, and left-without-being-seen (LWBS) rates.
- Lab turnaround dashboard: Monitors urgent stat panel completions and critical value notification times.
- Discharge queue dashboard: Flags patients with resolved medical barriers waiting on administrative transport.
Once hospital administrators require these isolated operational views to connect dynamically with deeper clinical or financial performance metrics, the infrastructure requirements naturally transition into a multi-source data ecosystem.
2. The $120K–$190K Build: Multi-Source Aggregation
A $120,000 to $190,000 deployment becomes necessary when an organization requires cross-departmental, multi-source real-time aggregation. This tier introduces mature data modeling, real-time identity matching, continuous stream validation, and unified executive views that allow leaders to evaluate capacity, clinical quality, and financial risk metrics simultaneously.
Expanding the platform to support concurrent data streams requires upgrading the foundational pipeline architecture:
- Multi-source real-time aggregation cost: Incorporates the design of robust schemas to merge unstructured feeds safely.
- EHR real-time integration cost: Connects primary clinical documentation systems directly to a streaming analytics layer.
- Real-time data ingestion cost: Drives the setup of high-throughput message brokers to prevent data drops during peak hours.
- Real-time ETL pipeline cost: Manages instantaneous data cleaning, deduplication, and vocabulary standardization.
Recommended use cases:
- Patient flow analytics cost: Maps cross-facility patient migrations from admission through acute care to discharge.
- Capacity planning analytics cost: Anticipates resource constraints across intensive care units, operating rooms, and staffing pools.
- Quality measure real-time tracking cost: Monitors active compliance against core quality metrics and value-based care targets.
- Revenue cycle real-time analytics cost: Surfaces immediate billing discrepancies, charge captures, and point-of-service documentation gaps.
- Care gap real-time identification cost: Flags admitted patients missing critical preventative screenings or standard protocol orders.
When a healthcare organization looks to transition from passive operational reporting to active, machine-learning-driven clinical intervention, the deployment moves directly into the enterprise tier.
3. The $200K–$300K Build: Predictive And Action-Oriented Analytics
A $200,000 to $300,000 budget fits enterprise healthcare networks that need definitive clarity on predictive analytics real-time integration cost parameters before routing capital requests for board approval.
This premier architecture integrates real-time machine learning inference, complex alerting engines, high availability, and automated compliance auditing to actively guide frontline clinical operations.
Operating live machine learning models on high-velocity health data demands an institutional-grade infrastructure layer:
- Predictive analytics real-time integration cost: Covers the infrastructure required to run concurrent mathematical models on volatile patient data.
- Real-time alerting engine cost: Manages complex notification logic, secure push routing, and clinician escalation trees.
- High availability analytics architecture cost: Guarantees continuous system uptime across multi-site hospital networks.
- Disaster recovery analytics platform cost: Establishes instantaneous failover regions to preserve live clinical tracking during local outages.
Recommended use cases:
- Readmission risk real-time cost: Scores transitional care candidates before discharge to deploy targeted home-health interventions.
- Length of stay prediction cost: Calculates exact barrier-to-discharge timelines automatically upon clinical intake.
- Staffing analytics real-time cost: Aligns shift schedules with real-time acuity models to prevent clinician burnout.
- Denial analytics real-time cost: Catches high-probability claim rejections automatically before submission to insurers.
- Population health real-time analytics cost: Groups complex chronic patient cohorts dynamically across regional care networks.
Selecting the appropriate development tier should always reflect your current operational maturity.
While a regional system does not require a complex, multi-site predictive suite if a focused, single-workflow MVP can prove immediate fiscal value, an enterprise network must build on unified architecture rather than disconnected reporting tools.
Real-Time Healthcare Analytics Architecture That Drives Cost
Your underlying technical architecture directly drives your ultimate analytics platform development cost because the environment must process thousands of continuous messages with sub-second latency while keeping PHI stringently isolated.
The core financial drivers span five distinct architectural layers: ingestion, streaming, storage, application delivery, and end-to-end security orchestration. If any single layer is built without clear horizontal scalability, your real-time analytics platform total cost of ownership will climb sharply.
Architecture Layer Cost Table
| Architectural Layer | Target Latency | Estimated Cost Range | Primary Open-Source / Cloud Stack Components |
| Data Ingestion | Sub-second | $15,000–$45,000 | Apache Kafka, Debezium (CDC), Cloud API Gateways, FHIR Subscription Listeners |
| Stream Processing | < 500 milliseconds | $20,000–$60,000 | Apache Flink, Apache Spark Streaming, AWS Kinesis, Managed Cloud Streams |
| Lakehouse & Analytics Storage | < 2 seconds | $15,000–$50,000 | Apache Iceberg, Delta Lake, Snowflake, ClickHouse, Amazon Timestream |
| Microservices & Presentation | Instant / Push | $20,000–$65,000 | React.js WebSockets, Node.js Microservices, Power BI / Tableau Embedded APIs |
1. Event-Driven Data Ingestion Layer
The event-driven data ingestion layer typically costs $15,000 to $45,000 because it must safely map, capture, and buffer high-frequency streams originating across disparate healthcare systems. This foundational boundary determines whether your platform can transition from passive, batched retrospective reporting to immediate, real-time operational awareness.
To build a reliable data intake pipeline, engineers must deploy a combination of legacy protocol listeners and modern webhooks:
- FHIR R4 subscription API cost: Powers continuous, event-triggered push notifications directly from compatible modern EHR setups.
- Change data capture implementation cost: Tracks transactional alterations inside legacy operational databases without degrading performance.
- CDC pipeline healthcare cost: Normalizes unstructured data feeds before routing them downstream to your message brokers.
- API integration cost real-time analytics: Establishes secure, credentialed microservice endpoints to collect external financial or clinical data.
Once your data is successfully captured and buffered within your message queues, it enters the stream processing engine for transformation.
2. Stream Processing And Transformation Engine
The stream processing layer usually costs $20,000 to $60,000 because it acts as the computational engine that converts raw, chaotic payloads into structured, time-aware medical metrics. This layer evaluates data across sliding time frames, joining distinct events like an updated lab result with an active bedside vitals monitor stream.
Developing this computing layer requires implementing highly optimized open-source or cloud-native processing frameworks:
- Kafka streaming infrastructure cost: Manages the baseline event-brokering environment, partitions, and multi-node replication sets.
- Apache Flink implementation cost: Deploys stateful, ultra-low-latency stream computation engines to run complex event processing rules.
- Apache Spark Streaming cost: Provides micro-batch processing configurations for workflows that can tolerate multi-second latency thresholds.
- Low-latency data processing cost: Measures and minimizes computational overhead during continuous metric aggregations.
Once the transformation engine calculates active metrics, those datasets must be stored in a performant environment optimized for immediate querying.
3. Lakehouse, Warehouse, And In-Memory Analytics Layer
The real-time storage and query layer costs $15,000 to $50,000 because it must handle concurrent historical lookbacks and volatile live metrics simultaneously. This environment must support instant, sub-second visualization queries without locking database tables or interrupting active background machine learning models.
Structuring this multi-tiered analytical storage layer involves configuring distinct storage topologies:
- Data lakehouse architecture cost: Implements structured transactional layers over raw cloud object storage to enable scalable analytical queries.
- Healthcare data lake real-time cost: Manages ongoing storage fees for high-density, raw event streams such as continuous physiologic monitors.
- In-memory analytics engine cost: Configures high-performance columnar or OLAP caching databases to handle instant dashboard rendering.
- Stream processing engine cost: Continuously indexes incoming data points into the appropriate historical partitions.
With your real-time data securely cached and stored, the final layer must securely expose these analytical metrics to your end-users.
4. Microservices, APIs, And Dashboard Delivery Layer
The application delivery layer usually costs $20,000 to $65,000 because it transforms abstract data pipelines into actionable user interfaces, secure push alerts, and interoperable APIs. This layer must manage active user sessions, govern data viewing rights, and handle dynamic WebSocket connections across thousands of concurrent clinical devices.
Building out the application layer requires integrating specialized visualization frameworks and security policies:
- Microservices analytics architecture cost: Enforces modular execution across distinct APIs, keeping your alerting logic separate from visualization routines.
- Custom visualization development cost: Delivers tailor-made React.js dashboards with live canvas elements for highly specialized clinical workflows.
- BI tool integration cost healthcare: Powers standard dashboards using embedded enterprise business intelligence suites like Tableau or Power BI.
- Executive dashboard development cost: Aggregates operational performance and labor efficiency metrics into macro-level organizational views.
Architecture expenses increase when “real-time” demands shift from simple chart updates to compliant, resilient infrastructure.
The entire environment must preserve absolute data context and absolute trust while information flows at high velocities.
Data Sources And Integrations That Change The Build Cost
Integration specifications represent the absolute largest variable affecting your choice to build real-time healthcare analytics platform cost parameters. While streaming an isolated data pipeline from a single system is highly predictable, aggregating disparate feeds simultaneously introduces significant development friction.
Moving into comprehensive enterprise environments requires deep schema normalization, multi-source identity resolution, active data quality validation, and rigorous real-time stream governance to ensure downstream operational dashboards remain mathematically accurate.
Healthcare Data Source Cost Table:
| Healthcare Data Source | Data Protocol Baseline | Processing Velocity | Estimated Integration Cost |
| EHR, ADT, & HL7 v2 | HL7 MLLP / TCP-IP | Event-by-event (Transactional) | $15,000–$55,000 |
| FHIR R4 Subscriptions | JSON over HTTPS Webhooks | Event-driven (Near instant) | $12,000–$40,000 |
| Bedside Medical Devices | MQTT / WebSockets / IoT | High-frequency continuous | $20,000–$65,000 |
| Claims & Billing Feeds | X12 EDI (837/835) | Micro-batch / Event streaming | $15,000–$50,000 |
1. EHR, ADT, and HL7 v2 Feed Streaming
Integrating legacy electronic health record infrastructure usually costs $15,000 to $55,000 due to variations in vendor message formatting, naming structures, and localized data entry workflows. Establishing an event-driven listener to capture admission, discharge, and transfer messages represents the highest-value starting point for most hospital systems.
Building out this foundational pipeline requires writing custom parsers to translate legacy string messages into structured analytical objects:
- EHR real-time integration cost: Covers the configuration of dedicated Minimal Lower Layer Protocol (MLLP) endpoints to receive active streams securely.
- ADT feed streaming cost: Captures immediate room changes, patient registration events, and discharge notices to power live floor tracking.
- HL7 v2 real-time feed cost: Manages the technical translation of pipe-delimited text payloads into clean, database-ready schemas.
- Patient identity matching: Normalizes local patient identifiers across separate facilities to maintain a single, accurate master index record.
Once your legacy clinical fields are streaming reliably, the platform can expand to support modern, API-first interoperability frameworks.
2. FHIR R4 Subscription APIs And Clinical Resource Updates
Implementing event-driven FHIR subscriptions typically ranges from $12,000 to $40,000, depending on your primary EHR vendor’s native capability to broadcast instant webhook alerts.
This modern API approach allows the platform to receive light JSON payloads the exact millisecond a clinician updates a specific medical chart.
Transitioning to an API-driven notification framework involves deploying modern cloud gateways and strict tokenization policies:
- FHIR R4 subscription API cost: Funds the development of secure webhook receiver endpoints optimized to handle high-concurrency push events.
- FHIR subscriptions implementation cost: Manages the mapping of distinct clinical resources like Patient, Observation, and Encounter objects into your storage lakehouse.
- SMART on FHIR authentication: Enforces strict OAuth 2.0 scopes and specialized security certificates to govern incoming payloads safely.
- API rate limit handling: Implements throttling mechanisms to protect your streaming infrastructure during unexpected network message spikes.
While FHIR subscriptions handle discrete clinical status changes elegantly, streaming high-density continuous waveforms from physiological hardware requires a different architecture.
3. Vitals, Bedside Devices, And Medical Device Streams
Connecting live physiological instrumentation carries an integration cost ranging from $20,000 to $65,000 because Internet of Medical Things (IoMT) hardware broadcasts continuous, high-volume telemetry. Processing these signals requires specialized ingestion gateways designed to handle sub-second sampling frequencies without dropping messages.
Managing continuous biomedical data streams involves constructing low-latency processing topologies:
- Vitals monitoring stream integration cost: Normalizes high-velocity biometric feeds including pulse oximetry, heart rates, and blood pressure updates.
- Bedside device integration cost: Coordinates data connections from smart pumps, ventilators, and telemetry units located across intensive care suites.
- Medical device data streaming cost: Manages the heavy computing overhead required to clean noisy electronic signals at the edge.
- IoMT gateway routing: Directs high-density diagnostic hardware messages cleanly into the central streaming analytics layer.
After stabilizing clinical and biomedical device integration lines, the infrastructure must ingest downstream financial events to track broader organizational metrics.
4. Claims, Revenue Cycle, And Operational Data Streams
Streaming financial transactions cost $15,000 to $50,000 because clearinghouse and revenue cycle management engines rely on complex Electronic Data Interchange (EDI) message sets. Merging live financial actions with active clinical timelines allows administrative leaders to catch expensive administrative errors before they result in final insurance rejections.
Building a live financial tracking pipeline requires parsing and cross-referencing multi-part administrative files:
- Claims data streaming integration cost: Establishes automated ingest pipes to process incoming institutional and professional billing datasets.
- Claims analytics streaming cost: Connects live financial clearinghouse activity logs directly to your analytical storage environment.
- Denial analytics real-time cost: Flags missing authorizations and coding mismatches automatically before claims leave the facility network.
- Revenue cycle real-time analytics cost: Monitors point-of-service collections, outstanding accounts receivable, and immediate charge-capture trends.
Data integration expenses scale up with every unique endpoint that requires active vocabulary normalization, temporal alignment, and continuous pipeline monitoring. For a deeper breakdown of EHR interface economics, see our guide on EHR Integration Platform Cost.
The next section will explain how these integrated data streams are transformed into live interactive dashboards and automated clinical alerting systems.
Real-Time Dashboards, Alerts, And Workflow Cost
A modern real-time healthcare dashboard development cost usually ranges from $18,000 to $75,000, depending on user roles, dashboard count, refresh frequency, alert logic, and workflow routing.
The primary cost driver is not front-end graphic design. Instead, the cost depends on turning live clinical, operational, and financial streams into secure, action-oriented cues for localized care and operations teams.
Visual Interface Workflow Cost
| Visual Interface / Workflow Module | Target Users | Key Data Connections | Estimated Budget Range |
| Clinical Dashboard | Physicians, Unit Nurses, Informatics Leads | Labs, Vitals, Medications, EHR Documentation | $20,000–$60,000 |
| Operational Dashboard | Facility Directors, ED Managers, Bed Coordinators | ADT Feeds, Staff Schedules, Transport Logs | $18,000–$55,000 |
| Executive Performance Dashboard | C-Suite Leaders, Chief Medical Officers | Financial Systems, Billing, Aggregated Quality Metrics | $15,000–$45,000 |
| Automated Alerting Engine | Frontline Responders, Escalation Teams | Streaming Engines, Pager APIs, Secure SMS | $20,000–$60,000 |
1. Clinical Dashboards For Risk, Deterioration, And Care Gaps
Developing a dedicated clinical dashboard typically costs $20,000 to $60,000 when the software must map, display, and prioritize active patient deterioration scores and care deficiencies.
These modules require separate visualization layers because a bedside floor nurse, a multi-unit manager, and a clinical informatics director interact with completely different situational signals.
Building these interfaces safely requires rendering high-density data alongside active quality guidelines:
- Real-time clinical analytics platform development cost: Finances the front-end rendering engines needed to process volatile physiologic streams.
- Early warning score streaming cost: Computes and displays dynamic acuity markers directly within the active patient view.
- Sepsis alert real-time system cost: Translates streaming laboratory values and temperature logs into clear diagnostic warnings.
- Deterioration detection streaming cost: Refreshes systemic organ failure risk metrics instantly as nursing staff chart fresh observations.
- Quality measure real-time tracking cost: Displays active checklists to help clinical teams achieve value-based target metrics during the patient encounter.
For a deeper look at managing complex clinical integration pathways, see our guide on Cost To Develop a Healthcare Data Interoperability Platform. While clinical interfaces protect individual patient safety, operational screens keep the broader facility running efficiently.
2. Operational Dashboards For Capacity, ED, And Staffing
An operational dashboard setup costs $18,000 to $55,000 when built to monitor emergency room bottlenecks, bed availability, and active staff distributions.
These platforms substitute slow retrospective management summaries with instant infrastructure insights, allowing supervisors to dispatch auxiliary transport and nursing resources before bottlenecks gridlock a facility.
Constructing an actionable throughput tracking interface demands tight coordination with hospital facility data:
- Capacity planning analytics cost: Models incoming patient counts against unassigned acute care beds to prevent boarding delays.
- Bed utilization analytics cost: Monitors active cleaning statuses, isolation attributes, and physical room assignments continuously.
- ED throughput analytics cost: Highlights emergency wait times, triaging speeds, and left-without-being-seen performance drops.
- Staffing analytics real-time cost: Compares floor nurse-to-patient counts against live unit acuity metrics to maintain safety margins.
- Patient flow analytics cost: Visualizes structural movement delays as individuals transition from surgery back to recovery rooms.
When operational throughput and clinical documentation function smoothly, those aggregated metrics feed directly into your executive oversight layers.
3. Executive Dashboards For Quality, Finance, And Performance
Building executive performance dashboards costs $15,000 to $45,000 because leadership requires unified, validated operational, financial, and clinical quality indicators across entire corporate regions.
This layer focuses primarily on unifying data terminology across varied facilities so executives compare matching financial variables when making capital adjustments.
Configuring an executive dashboard involves anchoring visual analytics to verified regulatory and economic definitions:
- Executive dashboard development cost: Connects cross-facility performance lines into clean, high-level graphical summaries.
- Compliance monitoring real-time cost: Audits active institutional adherence to state privacy laws, federal guidelines, and billing rules.
- Revenue cycle real-time analytics cost: Tracks unbilled documentation, active insurance hold times, and outstanding accounts receivable values.
- Operational efficiency ROI analytics: Illustrates exact resource cost savings derived from accelerated patient placement workflows.
- Decision speed improvement ROI: Measures institutional administrative response times following major capacity or bottleneck events.
To turn these passive data displays into active operational interventions, the environment requires an automated alerting framework.
4. Alert Routing, Suppression, And Human Review
Deploying a real-time alerting engine carries a cost of $20,000 to $60,000 because notification systems require complex rule trees to route messages to appropriate roles based on unit location and severity.
The platform must also manage strict message fatigue filters, ensuring repetitive notifications do not cause clinicians to ignore high-priority alerts.
Developing a functional medical alerting infrastructure involves building out distinct notification and validation microservices:
- Real-time alerting engine cost: Manages the underlying event brokers that evaluate data changes against emergency criteria.
- Alert prioritization: Segregates simple administrative notifications from high-priority, life-critical medical signals.
- Escalation rules: Forwards unacknowledged critical patient alerts automatically to secondary supervisors after fixed time intervals.
- Notification channels: Connects your internal alerting engine safely with approved clinical pagers, smartphones, and secure messaging channels.
- Suppression windows: Silences repetitive alerts for a single patient once a clinician acknowledges the active care plan.
Visual dashboards and automated alerting environments generate concrete financial return only when they successfully influence clinical decisions. The next section explores how embedding active, real-time machine learning models shifts your platform from passive monitoring to automated operational prediction.
AI-Powered Real-Time Analytics Platform Cost Drivers
An AI-powered real-time analytics platform cost increases when the architecture must score high-velocity risk feeds continuously, provide transparent predictive explanations, monitor mathematical baseline shifts, and support safe clinical interventions.
Building and training an isolated statistical model represents only a fraction of the total engineering effort.
Instead, the primary budget drivers span specialized streaming feature pipelines, dedicated low-latency model serving environments, automated MLOps tracking suites, and strict end-to-end model governance guardrails.
AI Infrastructure Element Cost Table
| AI Infrastructure Element | Primary Target | Expected Latency | Budget Range |
| Streaming Inference Engine | Continuous Risk Stratification | < 200 milliseconds | $25,000–$70,000 |
| Clinical Predictive Suite | Condition & Throughput Forecasts | Event-driven | $30,000–$90,000 |
| MLOps Pipeline Orchestration | Drift, Versioning, & Bias Audits | Continuous background | $20,000–$65,000 |
| Explainability & Trust Controls | Local Feature Contribution Logs | UI-integrated | $12,000–$45,000 |
1. Real-Time Risk Scoring And Streaming Inference
Deploying a real-time risk scoring engine costs $25,000 to $70,000 because your infrastructure must transform raw transactional health messages into structured model inputs instantly.
This specialized computing setup uses streaming feature pipelines that update mathematical parameters in memory, ensuring that machine learning models score patient risk scores using live, sub-second telemetry rather than outdated medical records.
Building out this responsive machine learning boundary requires setting up dedicated serving microservices:
- ML model real-time inference cost: Supports the computing infrastructure required to host high-concurrency neural networks or decision trees safely.
- Real-time risk scoring engine cost: Manages the active calculation of financial or clinical risk parameters as fresh events cross the messaging bus.
- Predictive analytics real-time integration cost: Integrates active inference pipelines directly with your operational end-user dashboards.
- Streaming feature stores: Standardizes and serves volatile analytical data points consistently across both training and live production environments.
Once the baseline inference environment is active, engineering teams can configure specialized clinical and administrative forecasting models.
2. Sepsis, Deterioration, LOS, And Readmission Models
Deploying specialized clinical machine learning models carries an integration cost ranging from $30,000 to $90,000, depending on data quality, local workflow risks, and validation rules.
Models predicting acute biological breakdowns or immediate hospital throughput constraints demand intensive testing against clean historical patient records before being integrated into active bedside environments.
Deploying these predictive layers requires establishing highly targeted algorithmic logic routines:
- Sepsis alert real-time system cost: Evaluates continuous white blood cell counts, lactic acid values, and core vitals to catch systemic infections early.
- Deterioration detection streaming cost: Monitors multi-organ failure risk thresholds dynamically by checking nursing notes and chart records.
- Length of stay prediction cost: Estimates total inpatient duration markers during initial admission triage to streamline discharge coordination.
- Discharge prediction model cost: Flags hidden operational or social barriers that delay safe patient transitions out of the acute care setting.
- Readmission risk real-time cost: Identifies high-risk chronic care candidates prior to departure to establish preventive home-care workflows.
For a deeper breakdown of population-level prediction systems, see our guide on the Clinical Intelligence Systems for Large Provider Networks. Live models require continuous oversight since algorithmic performance naturally degrades after initial deployment.
3. MLOps, Drift Monitoring, And Model Governance
Constructing automated MLOps pipelines usually ranges from $20,000 to $65,000 because live machine learning code must be monitored constantly for shifting performance.
At the same time, algorithmic accuracy declines over time as underlying patient populations shift, clinical coding standards update, or hospital documentation patterns change, requiring automated validation checks to flag precision drops.
Enforcing long-term algorithmic safety requires constructing a complete model management environment:
- MLOps pipeline cost real-time analytics: Funds the deployment of automated testing pipelines to handle versioned code retrainings.
- Model drift monitoring cost analytics: Tracks real-world precision outputs against original baseline validation metrics continuously.
- Versioned model registries: Catalogs every live, staging, and archived model iteration alongside its exact training history.
- Automated rollback systems: Reverts live inference endpoints instantly to previous trusted states if an update exhibits bias or latency spikes.
As performance tracking is established, the platform must expose the underlying math behind every prediction to gain institutional trust.
4. Explainability, Auditability, And Safe AI Controls
Integrating explainability and safe AI controls adds $12,000 to $45,000 to the platform budget, ensuring every calculated risk index remains fully auditable by hospital legal and clinical boards.
These specialized validation tools expose the precise clinical inputs that triggered an algorithmic warning, allowing medical personnel to trace an elevated risk index back to verifiable medical anomalies.
Building an auditable, transparent decision layer involves writing localized statistical tracking scripts:
- Explainable AI dashboards: Render clean, visual explanations detailing exactly why an analytical model generated a specific warning score.
- SHAP-style feature contribution maps: Break down the exact positive or negative weight each clinical variable exerted on the final risk index.
- Confidence score displays: Show internal statistical probability ratings alongside each prediction to prevent over-reliance on edge-case metrics.
- Human override logging: Documents every single instance where a licensed clinician dismisses or changes an automated system recommendation.
AI modules provide substantial operational foresight, but they also introduce distinct governance, tracking, and compute overheads. The next section explores how integrating strict HIPAA privacy protocols, data security wrappers, and business associate agreements affects your overall development budget.
HIPAA-Compliant Analytics Platform Development Cost
A HIPAA-compliant analytics platform development cost usually adds $15,000 to $60,000 to the total build budget. This investment ensures protected health information (PHI) remains secure as it flows through ingestion, processing, storage, and visualization layers.
Compliance requires end-to-end encryption, strict identity management, unalterable audit logging, signed vendor agreements, and active data governance infrastructure.
Compliance Layer Cost Table
| Compliance Layer | Core Focus | Regulatory Alignment | Budget Impact |
| Identity & Access | MFA, SSO, Attribute-Based Access Control | HIPAA Security Rule (Technical Safeguards) | $10,000–$35,000 |
| Audit & Logging | Immutable Log Storage, SIEM Logs, Activity Tracking | NIST SP 800-66r2 Guidelines | $8,000–$28,000 |
| Vendor Governance | BAA Execution, Encrypted Cloud Blueprints | HHS Vendor Safeguard Policies | $5,000–$20,000 |
| Data Governance | Quality Monitoring, Lineage, Schema Validation | Enterprise Operational Standards | $10,000–$40,000 |
1. PHI Encryption, Access Control, And Identity Management
Securing PHI within a streaming architecture costs $10,000 to $35,000 to implement end-to-end encryption, identity providers, multi-factor authentication, and strict user session controls.
Consequently, a role-based access analytics platform cost scales up because clinical, operational, financial, and analytical teams require distinct data views.
To establish a secure environment, engineers must move away from loose database permissions toward an absolute zero-trust framework. Therefore, the platform must wrap moving data packets in security keys at every stage of the pipeline.
To achieve this, the architecture implements the following technical controls:
- Data encryption real-time analytics cost: Encrypts streaming data payloads in transit via TLS 1.3 and at rest using AES-256 keys.
- Zero-trust architecture analytics cost: Evaluates every user request dynamically based on device state and network location.
- Multi-factor authentication (MFA) and Single Sign-On (SSO): Unifies user access with existing enterprise hospital directories.
- Break-glass access controls: Allows emergency overrides for clinicians during critical patient care events while logging the action.
Strict access management successfully protects platform boundaries, but compliance verification requires a complete trace of all user activities.
2. Audit Trails, Monitoring, And Compliance Evidence
An audit trail analytics platform cost typically ranges from $8,000 to $28,000 because federal guidelines mandate that every PHI transaction be completely traceable. For this reason, the system must capture every instance of dashboard viewing, report generation, data export, and machine learning prediction without performance loss.
Tracking streaming event access requires specialized, decoupled logging infrastructure that cannot be modified by administrators. According to the NIST SP 800-66r2 Guidelines, these compliance logs serve as legal evidence during regular institutional security reviews.
As a result, the logging framework tracks and records these specific platform interactions:
- Compliance monitoring real-time cost: Streams security events continuously into centralized evaluation systems.
- Immutable log repositories: Prevents any deletion or modification of system access records by privileged users.
- SIEM integration: Connects the platform’s security logs with external corporate monitoring software.
- Data export and admin activity logs: Archives every data download, permission change, and alert override instantly.
Reliable internal monitoring secures your application layer, but external cloud dependencies introduce additional compliance parameters.
3. BAA Requirements, Cloud Controls, And Vendor Governance
Moreover, managing BAA requirements analytics vendors adds $5,000 to $20,000 in specialized compliance review and configuration work. Every third-party cloud infrastructure platform, ingestion microservice, or analytics package handling PHI must execute a Business Associate Agreement before production data flows.
Selecting infrastructure partners requires auditing their native security frameworks and data hosting locations. As outlined in the HHS HIPAA Security Rule, organizations must choose cloud environments based on their specific compliance support tiers.
Consequently, the architecture isolates data within validated enterprise environments using these parameters:
- Cloud infrastructure cost analytics platform: Varies based on compute allocations and secure network data transfers.
- AWS real-time analytics cost: Deploys services within dedicated, HIPAA-eligible cloud architecture footprints.
- Azure real-time analytics cost: Utilizes specialized health cloud blueprints to maintain strict regulatory boundaries.
- Google Cloud real-time analytics cost: Coordinates streaming BigQuery and Pub/Sub instances under strict enterprise security profiles.
Infrastructure compliance keeps cloud data pools secure, but long-term accuracy depends on continuous data quality tracking.
4. Data Governance And Quality Monitoring
Finally, a data governance cost analytics platform layer usually ranges from $10,000 to $40,000 to maintain standardized definitions, validation rules, and lifecycle policies.
In addition, a data quality monitoring cost increases when multiple distinct hospital departments depend on the identical real-time feed for clinical and financial decisions.
Inaccurate real-time metrics can spread across a healthcare network rapidly if ingestion schemas are unmanaged. Thus, establishing a centralized metric dictionary ensures all users reference matching performance parameters.
The data management pipeline deploys these operational governance mechanisms:
- Master patient index logic: Resolves duplicate patient identities across distinct EHR data streams instantly.
- Data lineage tracking: Maps the exact transformation path of a metric from raw ingestion to the dashboard.
- Data validation rules: Drops or reroutes corrupted message frames before they reach visualization screens.
- Data retention policies: Automates the purging or archiving of older clinical events based on regulatory requirements.
Compliance is not an afterthought checklist. It shapes architecture, cloud footprints, and access maps from day one. The next section compares custom development approaches with off-the-shelf business intelligence frameworks.
Build Vs. Buy Healthcare Analytics Platform Cost
The build vs buy healthcare analytics platform cost choice should be determined by data ownership, workflow specificity, latency requirements, integration depth, compliance controls, and long-term operating costs.
Specifically, purchasing software works well when your internal reporting dashboards are highly standardized. Conversely, building becomes necessary when real-time clinical data streams, custom machine learning models, active clinical workflow routing, and granular PHI governance demand complete architectural control.
Build vs. Buy
| Strategic Pathway | Core Benefit | Primary Risk | Financial Model |
| Buy Standard Software | Rapid initial deployment, predictable upfront fees | High integration friction, continuous license scaling | Recurring SaaS Subscription Fees |
| Custom Engineered Build | Complete data ownership, specialized workflow logic | Higher engineering lift, slower initial time-to-market | Capitalized Development Investment |
| Hybrid Backend + BI | Custom real-time pipeline, standard visualization layer | Divided pipeline and dashboard troubleshooting loops | Shared Capital and Subscription Costs |
1. When Buying A BI Or Analytics Tool Makes Sense
Buying an off-the-shelf software solution makes sense when an organization requires standard operational reporting, retrospective historical dashboards, minimal interface customization, and a fast initial deployment window.
Commercial platforms or healthcare analytics SaaS products can significantly reduce immediate software engineering lift when the primary use case does not demand complex stream processing infrastructure, real-time clinical alerts, or proprietary predictive model hosting.
Utilizing pre-built business intelligence tools lowers the initial engineering requirement by utilizing standard connectors:
- BI tool integration cost healthcare: Varies based on seat volume and secure corporate network tunnel configurations.
- Tableau integration cost healthcare: Connects analytical visual front ends to traditional, static database warehouses.
- Power BI integration cost healthcare: Embeds relational data charts directly into existing corporate productivity suites.
Therefore, buying standard software is highly efficient when your primary institutional need is retrospective reporting from stable, structured data warehouses.
2. When A Custom Healthcare Analytics Platform Is Better
Alternatively, custom software engineering is better when you need absolute control over your streaming healthcare analytics platform cost across live EHR feeds, ADT events, continuous vitals, financial claims, automated alerts, and complex clinical workflows.
This approach provides uncompromised ownership over your system data architecture, data privacy controls, algorithmic model governance, and long-term product capabilities.
Constructing an enterprise environment involves assembling specialized, decoupled streaming software blocks:
- Custom healthcare analytics platform cost: Focuses capital resources directly on building proprietary data assets rather than paying software licenses.
- Enterprise healthcare analytics platform build cost: Establishes a highly resilient cloud data system tailored for multi-facility operations.
- Streaming healthcare analytics platform cost: Implements low-latency processing code to evaluate volatile medical data instantly.
- Multi-tenant analytics platform cost: Segregates distinct hospital regional networks safely within a single, scalable code footprint.
- Microservices analytics architecture cost: Enforces modular execution across distinct APIs, keeping your alerting logic separate from visualization routines.
Thus, building a custom platform is recommended when your competitive and operational advantages depend directly on raw data speed, localized clinical workflow matching, and proprietary model ownership.
3. When Hybrid Build-Plus-BI Works Best
Furthermore, a hybrid build-plus-BI strategy functions optimally when an organization wants to create custom ingestion, real-time streaming, and predictive AI logic, but still prefers to use existing enterprise tools like Power BI or Tableau for end-user dashboard presentation.
This architecture significantly lowers custom user-interface design costs while preserving strict ownership over your underlying healthcare data pipelines and real-time decision microservices.
Integrating a custom real-time backend with a commercial visualization tool requires exposing optimized query endpoints:
- Custom data processing backends: Manage high-concurrency ingestion, clinical vocabulary cleaning, and low-latency metrics calculations.
- BI visualization front ends: Render operational performance graphs using pre-built corporate interface components.
- Secure semantic data layers: Map processed lakehouse data points into understandable definitions for standard business analysts.
Consequently, using a hybrid approach is ideal when your underlying analytics logic is highly specialized, but your basic dashboard rendering does not require custom code.
4. Real-Time Analytics Platform Total Cost Of Ownership
Ultimately, evaluating a real-time analytics platform total cost of ownership requires calculating initial build costs, continuous cloud infrastructure fees, persistent performance monitoring, regular security audits, vendor tool packages, model updates, support labor, and future feature expansions.
Annual maintenance typically adds 15% to 25% of the initial development cost, whereas highly complex streaming environments processing millions of monthly events demand dedicated engineering oversight.
Maintaining a live analytics production platform requires continuous operational allocations:
- Real-time analytics platform total cost of ownership: Extends far beyond initial delivery to encompass long-term computing and engineering support.
- Ongoing maintenance cost analytics platform: Funds continuous software optimizations, framework patches, and structural updates.
- Cloud hosting and automated DevOps monitoring: Guarantees compute stability, data throughput, and sub-second latency across all regions.
- Data connector upkeep and schema adjustments: Modifies pipeline filters whenever source EHR fields or clinic workflows alter their native formats.
The choice to build or buy is fundamentally a decision about operational control, rather than a simple price comparison. The optimal path balances development speed, data ownership, regulatory compliance, and long-term operating costs. For a deeper breakdown of healthcare AI product costs, see our guide on AI Healthcare App Development Cost.
The next section outlines the step-by-step phased roadmap required to build and deploy this platform successfully.
How To Build A Real-Time Healthcare Analytics Platform
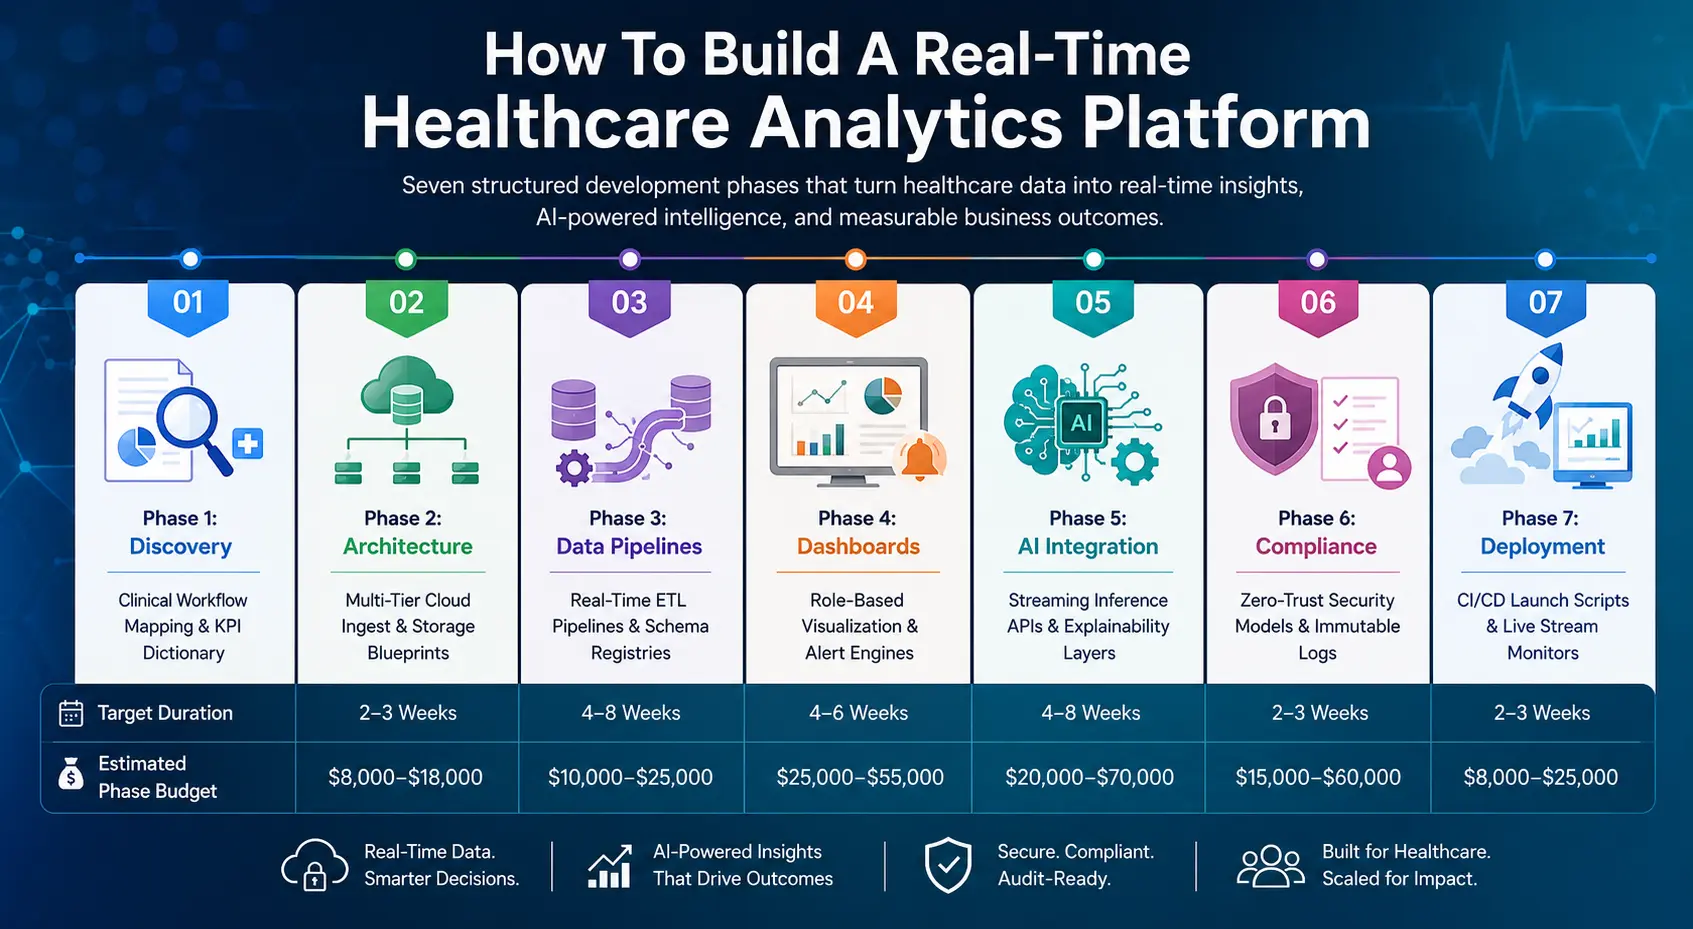
Building an enterprise-grade real-time healthcare analytics platform requires seven structured development phases. These phases span discovery, architectural planning, ingestion setup, stream processing, dashboard design, AI model integration, and compliance validation.
Consequently, each distinct engineering step must deliver a production-ready artifact, ranging from data schema mappings and architecture blueprints to live analytical dashboards, alert logic engines, active model monitors, and audit logs.
Phase-Wise Development Cost Table
| Development Phase | Primary Technical Output | Target Duration | Estimated Phase Budget |
| Phase 1: Discovery | Clinical Workflow Mapping & KPI Dictionary | 2–3 Weeks | $8,000–$18,000 |
| Phase 2: Architecture | Multi-Tier Cloud Ingest & Storage Blueprints | 2–4 Weeks | $10,000–$25,000 |
| Phase 3: Data Pipelines | Real-Time ETL Pipelines & Schema Registries | 4–8 Weeks | $25,000–$80,000 |
| Phase 4: Dashboards | Role-Based Visualization & Alert Engines | 4–6 Weeks | $18,000–$55,000 |
| Phase 5: AI Integration | Streaming Inference APIs & Explainability Layers | 4–8 Weeks | $20,000–$70,000 |
| Phase 6: Compliance | Zero-Trust Security Models & Immutable Logs | 2–3 Weeks | $15,000–$60,000 |
| Phase 7: Deployment | CI/CD Launch Scripts & Live Stream Monitors | 2–3 Weeks | $8,000–$25,000 |
Step 1 — Define Use Cases, Users, And Success Metrics
The initial discovery phase typically costs $8,000 to $18,000 and focuses on establishing explicit care team workflows, operational users, target metrics, latency goals, data locations, and regulatory requirements.
Therefore, this step prevents engineering teams from designing generic data dashboards that look visually appealing but fail to improve real-world clinical, financial, or administrative choice loops.
To anchor development scope effectively, project leads map the complete lifecycle of moving data points:
- Operational workflow mapping: Outlines exactly how a frontline clinician or facility coordinator will use an incoming data point.
- KPI metric dictionaries: Standardizes mathematical calculation rules across distinct medical units before writing code.
- Data source inventory reviews: Identifies legacy EHR fields, ADT feeds, and laboratory databases required to feed the platform.
- Latency target definitions: Segregates fields requiring sub-second alert updates from those that tolerate multi-minute batch updates.
Once your core organizational use cases and target datasets are clearly cataloged, the engineering team can begin mapping the technical system blueprints.
Step 2 — Design The Real-Time Analytics Architecture
Designing a resilient technical architecture costs $10,000 to $25,000 and maps exactly how streaming packets move from source hospital systems into ingest, storage, and visualization layers.
This phase must specify your primary cloud infrastructure configurations, event bus topologies, open APIs, legacy feed connections, data access schemas, and high-availability backup systems.
Constructing a stable environment model requires making foundational technology stack decisions:
- Architecture diagram production: Creates uncompromised, end-to-end data maps detailing software and cloud interface boundaries.
- Cloud service selection profiles: Chooses specific cloud endpoints based on native security parameters and ongoing compute costs.
- Managed stream processing engines: Determines when to utilize high-concurrency tools like Apache Flink or Apache Spark Streaming.
- Disaster recovery (DR) planning: Establishes cross-region database replication protocols to maintain uptime during local server outages.
With a fully approved architectural model in place, developers can safely begin constructing live data ingestion pipelines.
Step 3 — Build Real-Time Data Ingestion And ETL Pipelines
Building out data intake infrastructure carries a pipeline development cost ranging from $25,000 to $80,000 because engineers must ingest, clean, validate, and organize unstructured healthcare events instantly.
This phase manages the primary implementation of legacy HL7 listeners, modern FHIR endpoints, and real-time electronic transaction parsing scripts.
Developing high-throughput processing lines requires writing strict data cleaning and routing protocols:
- Real-time ETL pipeline cost: Funds the development of low-latency scripts to transform raw strings into queryable database models.
- Clinical data streaming cost: Sets up dedicated data pipes to move laboratory results, pharmacy requests, and vitals smoothly.
- Automated data validation rules: Evaluates moving payloads instantly to catch corrupt or missing clinical fields before processing.
- Dead-letter error queues: Isolates malformed message formats safely to prevent system processing blockages during heavy traffic.
After data pipelines are delivering clean, structured events continuously, those streams can feed into your user interface modules.
Step 4 — Develop Dashboards, Alerts, And Role-Based Views
Developing custom visual interfaces costs $18,000 to $55,000, depending on user seat counts, interface quantity, data refresh rates, alert logic trees, and embedded reporting tools.
The goal of this phase is to supply every specific user group with the exact operational information they need, rather than displaying every metric the system captures.
Building out a functional visualization application requires designing role-specific chart views:
- Custom visualization development cost: Crafts purpose-built web screens with push-state configurations to display live patient data.
- BI tool integration architecture: Connects established corporate visualization suites securely to your real-time processing layer.
- Role-based visualization filters: Customizes display scopes so clinical teams view patient records while finance teams view billing lines.
- Alert threshold configuration logic: Maps specific medical criteria to automated system warning modules to flag emerging clinical events.
Once intuitive presentation dashboards are operating stably, your development team can layer predictive artificial intelligence engines onto your data streams.
Step 5 — Add Predictive Models And Streaming Inference
Integrating predictive artificial intelligence features requires an engineering phase investment ranging from $20,000 to $70,000, depending on model selections, data formatting, and algorithmic explanation rules.
This phase embeds active statistical models directly within your moving data streams to forecast critical events like sepsis risks or impending department bottlenecks.
Operating live machine learning pipelines on streaming data requires building out low-latency execution endpoints:
- Model development cost phase analytics: Finances the optimization and scaling of mathematical algorithms for production environments.
- Streaming feature engineering services: Generates real-time mathematical parameters from high-frequency transactional data streams.
- Real-time inference API deployment: Connects trained neural networks directly to your live messaging queues for continuous scoring.
- Model explainability tracking layers: Exposes the precise clinical data points that drove an algorithmic risk calculation.
After machine learning models are operational, the entire platform must undergo security hardening.
Step 6 — Implement HIPAA Controls And Compliance Testing
Security hardening and regulatory testing costs $15,000 to $60,000 because your infrastructure must isolate PHI flawlessly across all movement, storage, visualization, and logging points.
This phase implements structural system defense measures, including multi-tier database encryption, access authorization hooks, immutable access archives, and vendor risk validation loops.
Enforcing an airtight regulatory envelope involves executing a series of specialized cybersecurity procedures:
- Data encryption real-site execution: Wraps all moving data sets in cryptographic layers both in transit and at rest.
- Role-based access control (RBAC): Restricts data accessibility by cross-referencing user credentials against active organizational roles.
- Immutable compliance audit logging: Builds secure, unalterable log environments to record every single data access transaction.
- External penetration testing: Conducts simulated system strikes to uncover and patch application vulnerabilities before launch.
Following a successful compliance audit, the platform moves into the final deployment and continuous optimization loop.
Step 7 — Deploy, Monitor, And Improve The Platform
The final release and stabilization phase costs $8,000 to $25,000, managing controlled rollout protocols, monitoring tools setup, system documentation, and clinical user onboarding.
The first production release focuses entirely on tracking infrastructure latency, data feed health, dashboard engagement levels, model scoring precision, and technical support requests.
Hardening a live production application requires configuring active system monitoring software suites:
- Deployment cost real-time analytics: Funds the creation of automated continuous integration and continuous deployment pipelines.
- Cloud infrastructure monitoring dashboards: Track CPU utilization, memory distribution, and API transmission performance.
- Data pipeline telemetry tracking: Fires immediate technical warnings if source EHR connections experience communication delays.
- Alert optimization and tuning routines: Refine system notification criteria using real-world usage logs to reduce alert fatigue.
The technical build roadmap must reduce operational risk systematically at every step. A real-time analytics project becomes significantly easier to fund when each sequential phase delivers a concrete technical asset, a clear cost boundary, and a measurable workflow benefit.
Build A Real-Time Healthcare Analytics Platform With Intellivon
Intellivon helps healthcare organizations build real-time analytics platforms that turn live clinical, operational, device, and claims data into secure decision infrastructure.
The team supports architecture planning, data pipeline development, dashboard engineering, AI model deployment, HIPAA controls, MLOps, and rollout planning so leaders can move from delayed reporting to action-ready intelligence.
1. We Start With Workflow And Data Readiness
Intellivon begins by identifying the decisions your analytics platform must improve. This includes patient flow, bed capacity, deterioration risk, discharge planning, quality reporting, claims visibility, and executive performance tracking.
The team then reviews your EHR feeds, ADT events, lab data, device streams, claims files, and operational systems to see what is ready for real-time ingestion. This prevents your first build from turning into a broad, expensive data cleanup project.
2. We Design The Streaming Analytics Architecture
Intellivon designs the real-time architecture around your latency needs, data volume, integration limits, and security requirements. This can include HL7 v2 feeds, FHIR APIs, event-driven ingestion, stream processing, lakehouse storage, secure APIs, and role-based dashboards.
The goal is not to create another reporting layer. The goal is to build a controlled analytics foundation that can support live dashboards, alerts, predictive models, and future use cases without rebuilding the core system.
3. We Build Dashboards Around Action, Not Just Visibility
Intellivon develops dashboards for the people who need to act on live data. Clinical teams may need risk and deterioration views. Operations teams may need ED throughput, capacity, staffing, and discharge dashboards. Executives may need quality, revenue, utilization, and performance views.
Each dashboard is designed around one practical question: what should the user do next? This keeps the platform focused on decision speed, not just data display.
4. We Add AI Where Prediction Changes Outcomes
Intellivon adds AI only where prediction improves prioritization, response, or planning. Common use cases include readmission risk, deterioration detection, length of stay prediction, discharge readiness, denial risk, anomaly detection, and capacity forecasting.
Each model includes explainability, confidence scoring, monitoring, drift checks, and human review workflows. This keeps AI useful, governed, and safe for healthcare environments.
5. We Make HIPAA Compliance Part Of The Build
Intellivon builds compliance into the platform architecture from the first release. This includes PHI encryption, role-based access, secure APIs, audit trails, vendor review, monitoring, and compliance evidence for enterprise security teams.
The platform is designed so healthcare leaders can track who accessed data, what changed, which alerts fired, and how AI outputs were reviewed.
Talk To Intellivon About Your Analytics Platform Roadmap
If your team is planning a real-time healthcare analytics platform, Intellivon can help define the right first release, architecture, cost range, integration roadmap, AI scope, and compliance plan before capital approval. Share your target workflows, data sources, and dashboard goals, and the team can help turn them into a buildable roadmap.
Conclusion
Securing capital approval for a real-time healthcare analytics platform requires balancing infrastructure costs with measurable decision speed and improved clinical outcomes.
Whether you choose to deploy a focused operational dashboard MVP or scale up to an AI-powered enterprise data lakehouse, matching your initial architecture to specific, action-oriented workflows ensures immediate returns on investment.
By prioritizing scalable data ingestion and strict compliance controls, healthcare organizations can successfully transition from retrospective reporting to proactive, live decision support.
Things To Know About Real-Time Healthcare Analytics Cost
Q1. How much does a real-time healthcare analytics platform cost?
A1. An enterprise analytics platform development cost typically ranges from $70,000 to $300,000 based on your chosen features. Specifically, a narrow dashboard MVP requires $70,000 to $110,000. Alternatively, a multi-source streaming system costs $120,000 to $190,000, whereas an AI-powered platform with predictive models reaches $200,000 to $300,000.
Q2. How long does it take to build a real-time healthcare analytics platform?
A2. Deploying a focused operational MVP usually requires 10 to 14 weeks of development time. Consequently, a comprehensive multi-source architecture demands 4 to 6 months. Finally, an advanced AI-powered platform with deep EHR pipelines, medical device streaming, and rigorous compliance testing takes 6 to 9 months to complete.
Q3. What increases custom healthcare analytics platform cost the most?
A3. The baseline custom healthcare analytics platform cost increases most from complex EHR integrations and continuous medical device streams. In addition, implementing automated data quality monitoring and real-time AI inference drives infrastructure expenses up. Thus, the total investment rises fastest when combining low-latency performance with strict data governance.
Q4. Is Power BI or Tableau enough for real-time healthcare dashboards?
A4. Commercial BI tools are highly effective when rendering visual analytics on top of pre-structured data stores. However, they are insufficient when your architecture requires custom streaming ingestion or real-time clinical alerts. Therefore, implementing a hybrid framework that blends custom data pipelines with commercial dashboards often provides the optimal balance.
Q5. What AI models are needed in a real-time clinical analytics platform?
A5. A real-time clinical analytics platform development cost typically covers predictive suites like sepsis alerts and readmission risk models. Furthermore, organizations frequently embed length of stay forecasting and continuous anomaly detection. As a result, each model requires specialized streaming feature pipelines and drift monitoring to maintain production safety.
To Sum Up:
- Real-time analytics becomes expensive when hospitals treat live data as a dashboard feature instead of a streaming architecture requirement.
- A $70,000 analytics MVP can prove value, but it should focus on one workflow such as ED throughput, bed utilization, discharge readiness, or lab turnaround.
- The highest hidden cost is not AI model development. It is data quality, source monitoring, feed reliability, and workflow trust.
- Power BI and Tableau can support visualization, but they do not replace a governed real-time ingestion, streaming, and alerting layer.
- A custom healthcare analytics platform only makes sense when speed, workflow specificity, PHI control, and model ownership justify the build.